Fig. 3
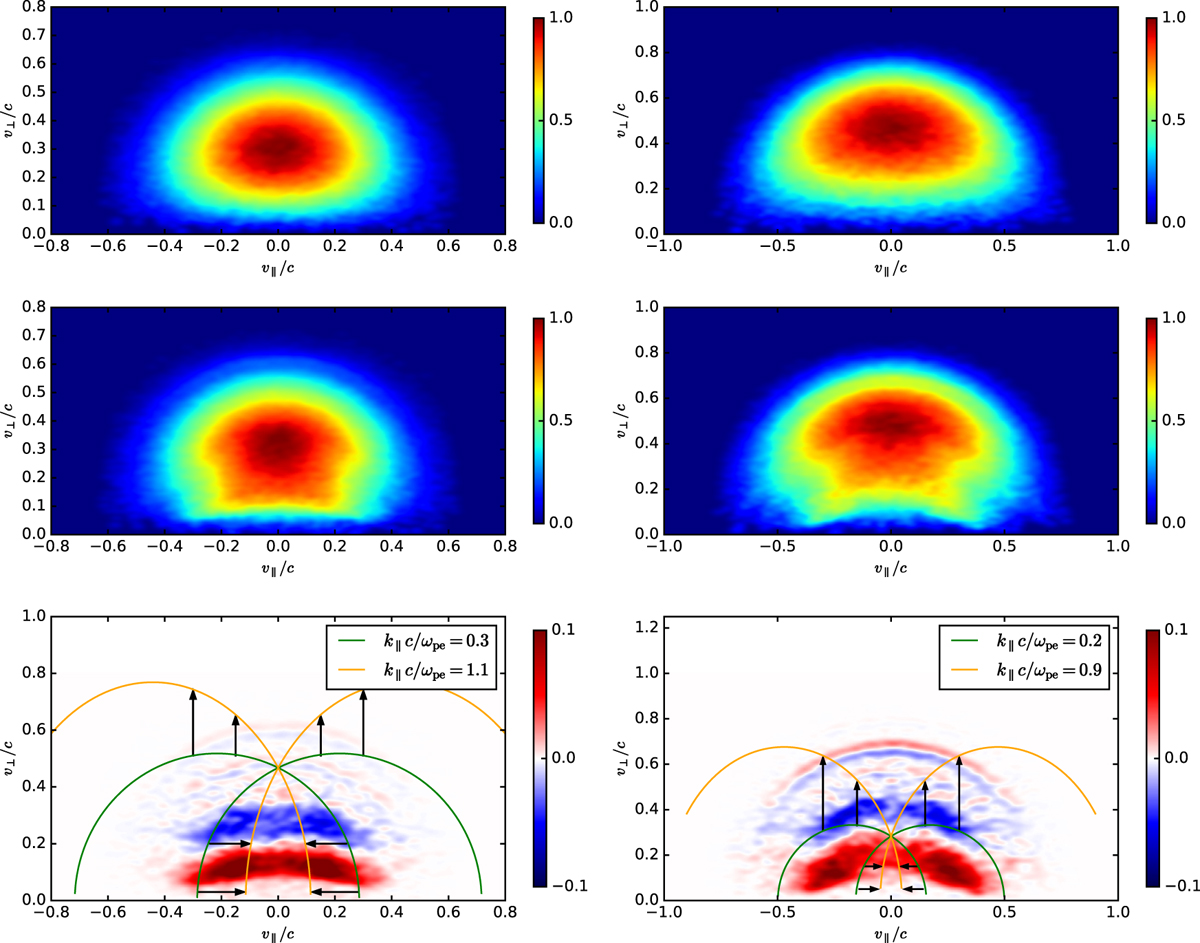
Changes of the electron distribution functions of hot electrons during the DPR instability. Left column: Model 2M with s = 6. Right column: Model 4M with resonance s = 5. First row: the distribution at the initial state. Second row: the distribution at ωpe t = 1000. Distributions are normalized to their maximal value. Third row: the difference of the distributions between the initial state and at ωpe t = 1000. Red regions are with enhanced densities and blue ones are with reduced densities. Elliptical lines show the resonance ellipses for a given k-wave vector along magnetic field. Black arrows show that the ellipses shift with increasing value of k∥ .
Current usage metrics show cumulative count of Article Views (full-text article views including HTML views, PDF and ePub downloads, according to the available data) and Abstracts Views on Vision4Press platform.
Data correspond to usage on the plateform after 2015. The current usage metrics is available 48-96 hours after online publication and is updated daily on week days.
Initial download of the metrics may take a while.