Free Access
Fig. 15
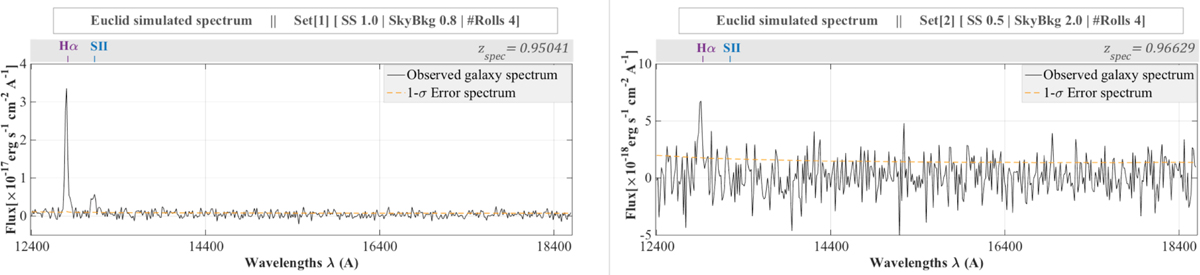
Simulated Euclid spectra. Left: simulated galaxy spectrum (id: 53678850) in the dataset S1 with an identifiable H α line at 12803A. Right: simulated galaxy spectrum (id: 56932048) in the dataset S2 with a H α emission line at 12908A.
Current usage metrics show cumulative count of Article Views (full-text article views including HTML views, PDF and ePub downloads, according to the available data) and Abstracts Views on Vision4Press platform.
Data correspond to usage on the plateform after 2015. The current usage metrics is available 48-96 hours after online publication and is updated daily on week days.
Initial download of the metrics may take a while.