Free Access
Fig. 1
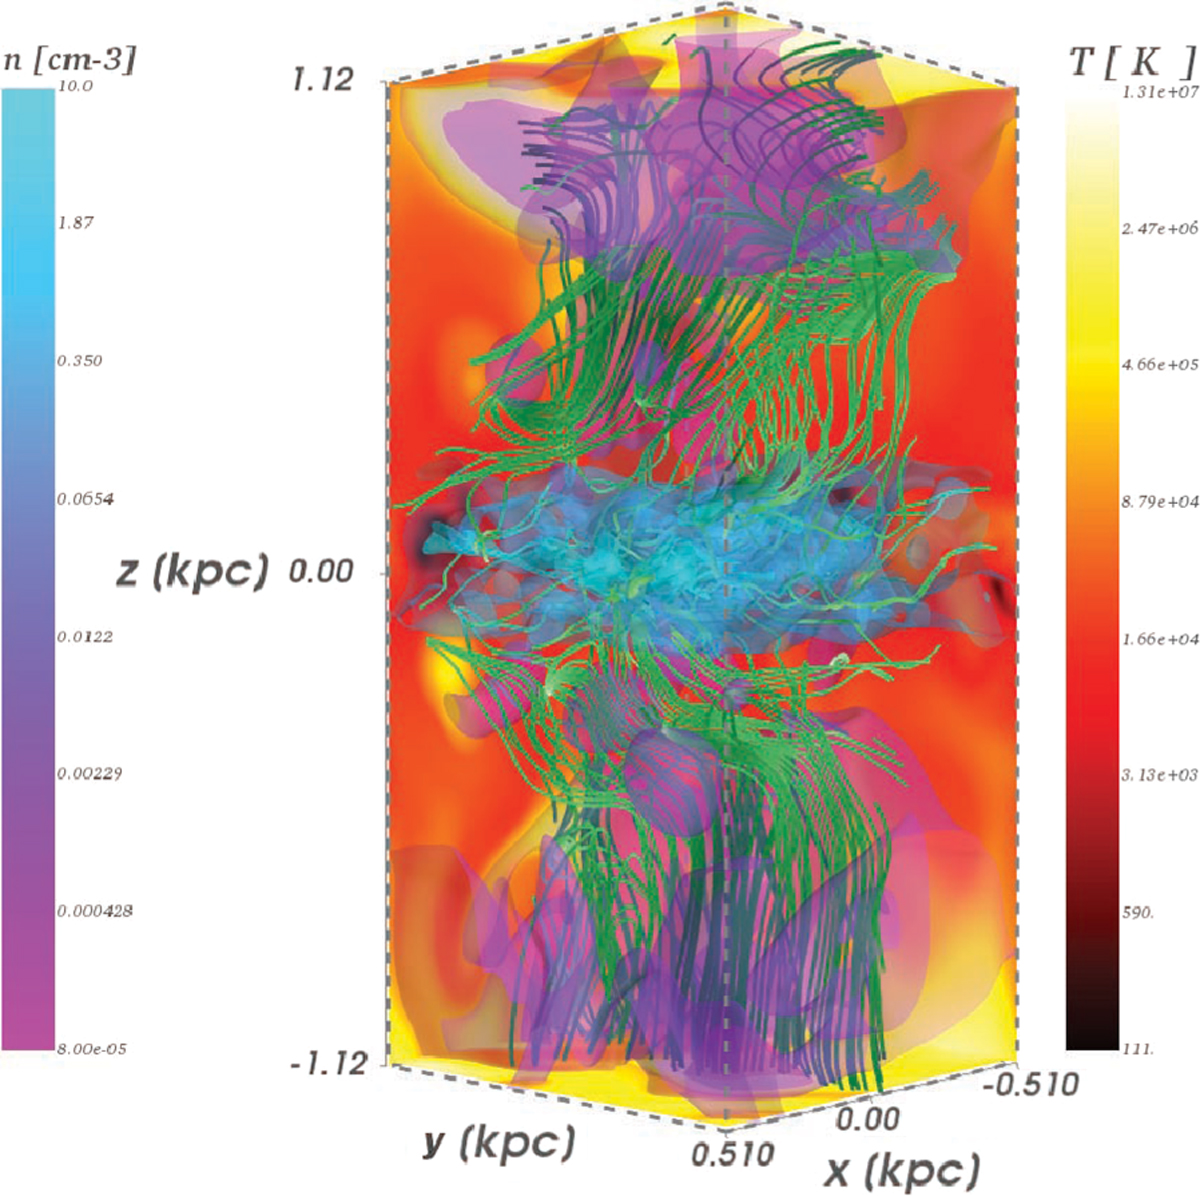
Representative snapshot from Run 1Ωp with contours on the top, bottom, and back surfaces of the simulation box indicating the ISM temperature (red-yellow), and isosurfaces within the box indicating the gas density (purple-cyan). Streamlines of velocity (green) are plotted through the isosurfaces.
Current usage metrics show cumulative count of Article Views (full-text article views including HTML views, PDF and ePub downloads, according to the available data) and Abstracts Views on Vision4Press platform.
Data correspond to usage on the plateform after 2015. The current usage metrics is available 48-96 hours after online publication and is updated daily on week days.
Initial download of the metrics may take a while.