Fig. 5
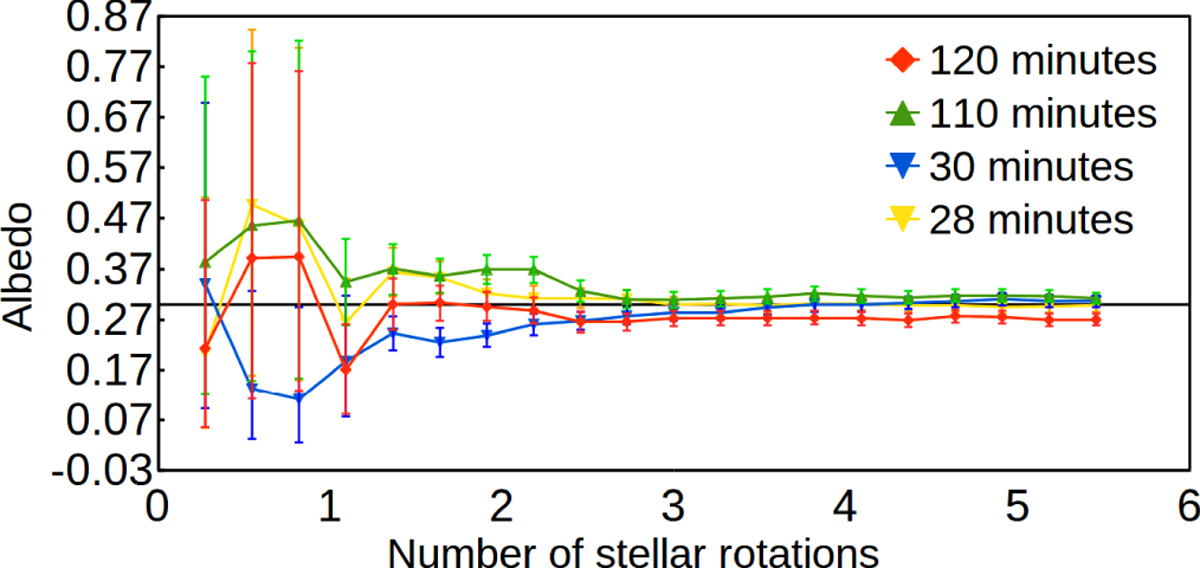
Comparison between albedo values obtained for the 11-day rotator and with increasing duration of the observations, but in simulations with four different timings, 120 min as usual, 110, 30, and 28 min. The x-axis is the number of observed stellar rotations. For all the analyzed light curves, the unmentioned input properties are the same as described in the caption of Figure 4.
Current usage metrics show cumulative count of Article Views (full-text article views including HTML views, PDF and ePub downloads, according to the available data) and Abstracts Views on Vision4Press platform.
Data correspond to usage on the plateform after 2015. The current usage metrics is available 48-96 hours after online publication and is updated daily on week days.
Initial download of the metrics may take a while.