Fig. 1
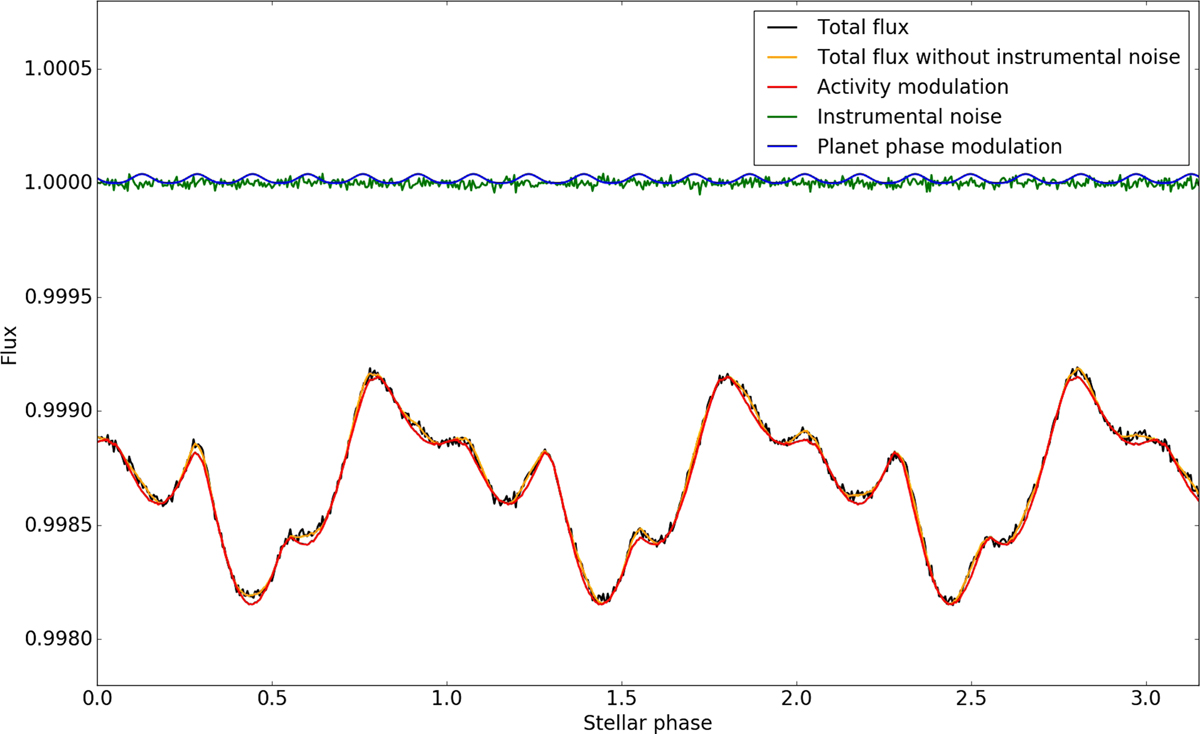
Typical phase light curve. It shows the normalized stellar flux as a function of the stellar phase. The green and blue lines represent the instrumental noise and the planet phase modulation, respectively, both shifted by 1. The planet phase modulation is built with an albedo of 0.3, a planetary radius Rp = 0.1 R*, and properties as listed in Table 7. The red line is the stellar activity modulation as listed in Table 6, the black line shows the total flux, and the orange line is the total flux without the instrumental noise. This example light curve is also adopted for most of the tests performed in this paper.
Current usage metrics show cumulative count of Article Views (full-text article views including HTML views, PDF and ePub downloads, according to the available data) and Abstracts Views on Vision4Press platform.
Data correspond to usage on the plateform after 2015. The current usage metrics is available 48-96 hours after online publication and is updated daily on week days.
Initial download of the metrics may take a while.