Fig. 3
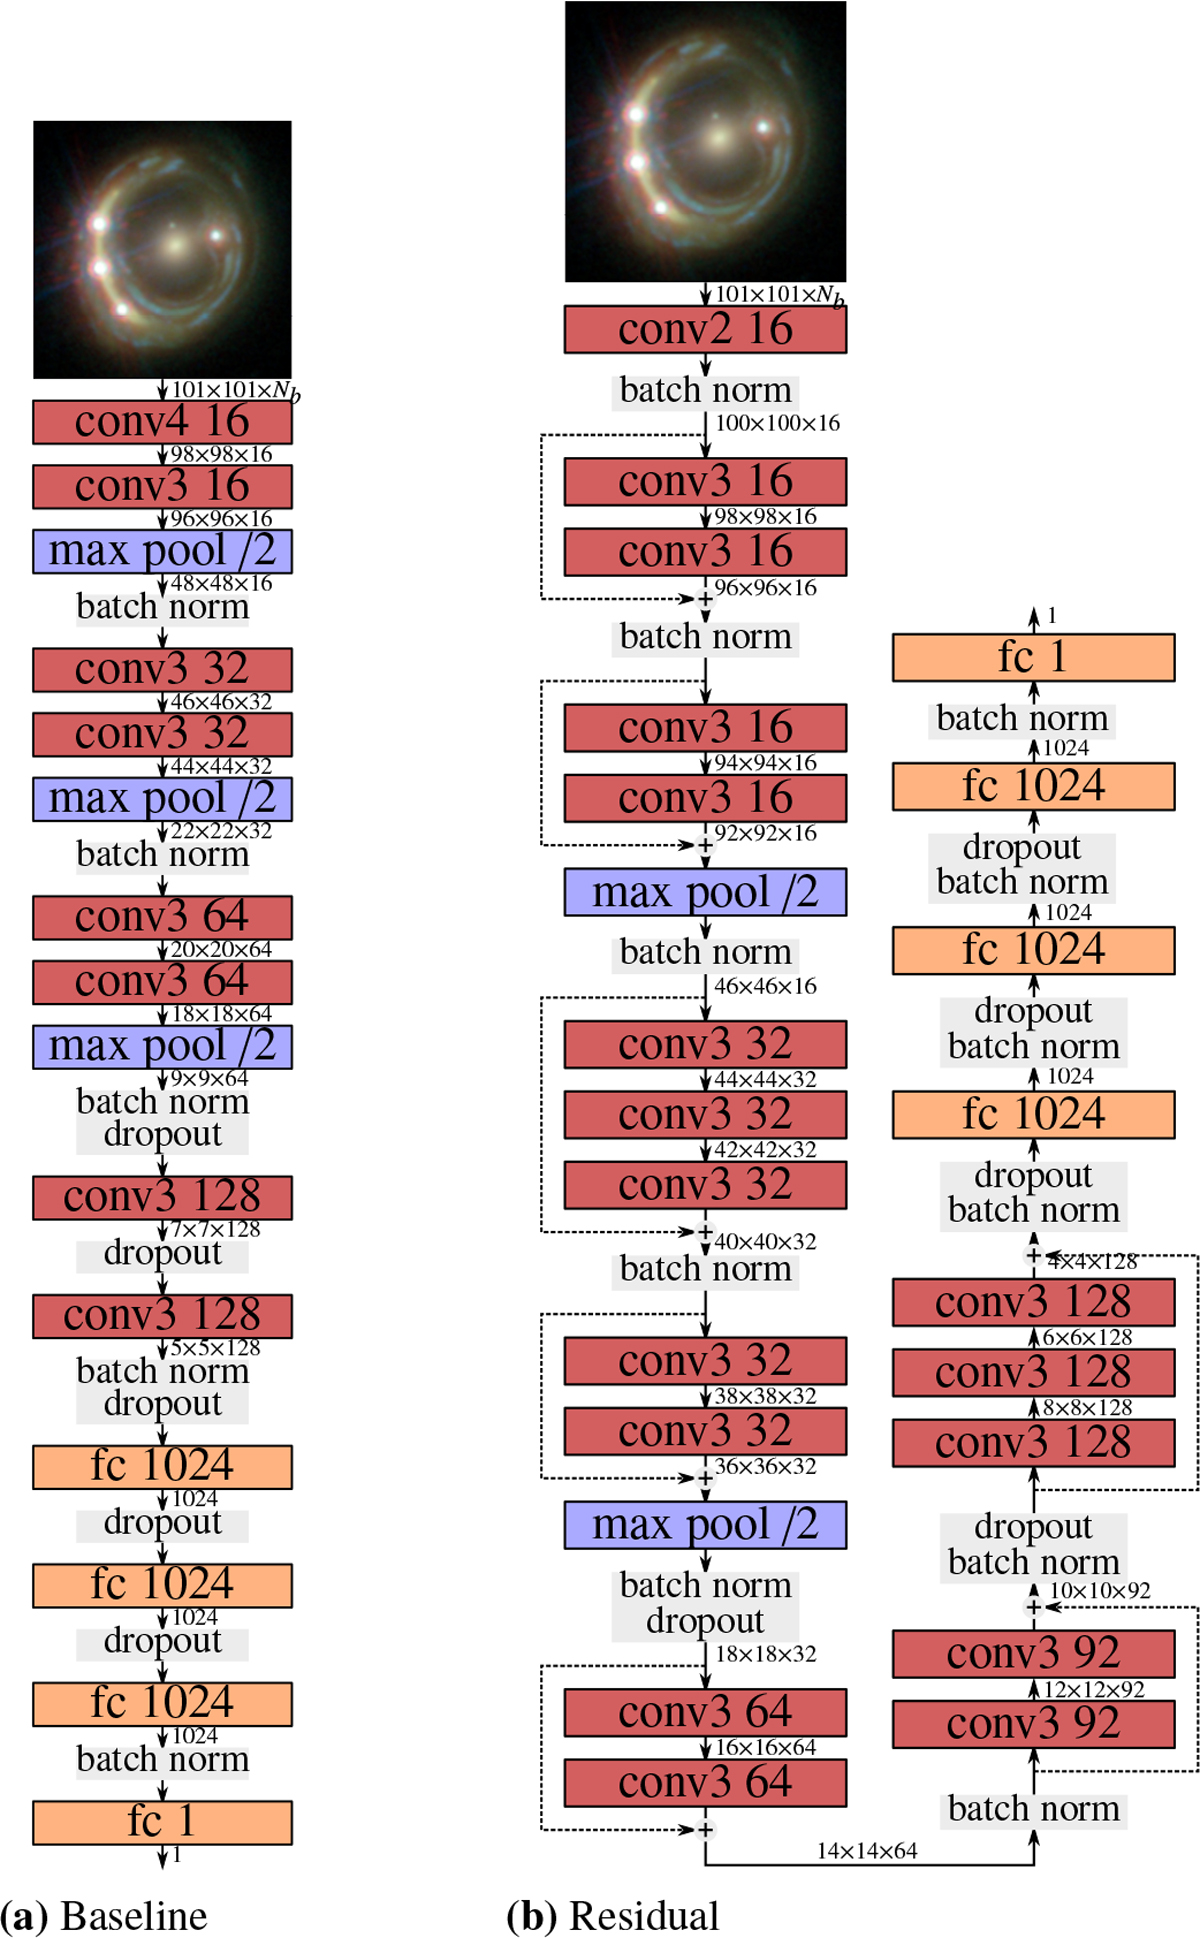
Visualization of the baseline and residual architecture for the CNN lensfinder: the convolution blocks (red) indicate thesize of the kernel and the number of features. The fully connected blocks (yellow) indicate the number of features. The arrows indicate the flow of the data, and between the blocks, we show the dimensionality of the input (Npixel × Npixel × Nfeatures). The last fully connected layer yields a confidence value of the object being a lens. The initial layer has Nb features, either one or four, depending on the category of the data (space and ground, respectively). Batch normalization and dropoutlayers are indicated as gray blocs.
Current usage metrics show cumulative count of Article Views (full-text article views including HTML views, PDF and ePub downloads, according to the available data) and Abstracts Views on Vision4Press platform.
Data correspond to usage on the plateform after 2015. The current usage metrics is available 48-96 hours after online publication and is updated daily on week days.
Initial download of the metrics may take a while.