Free Access
Fig. 8
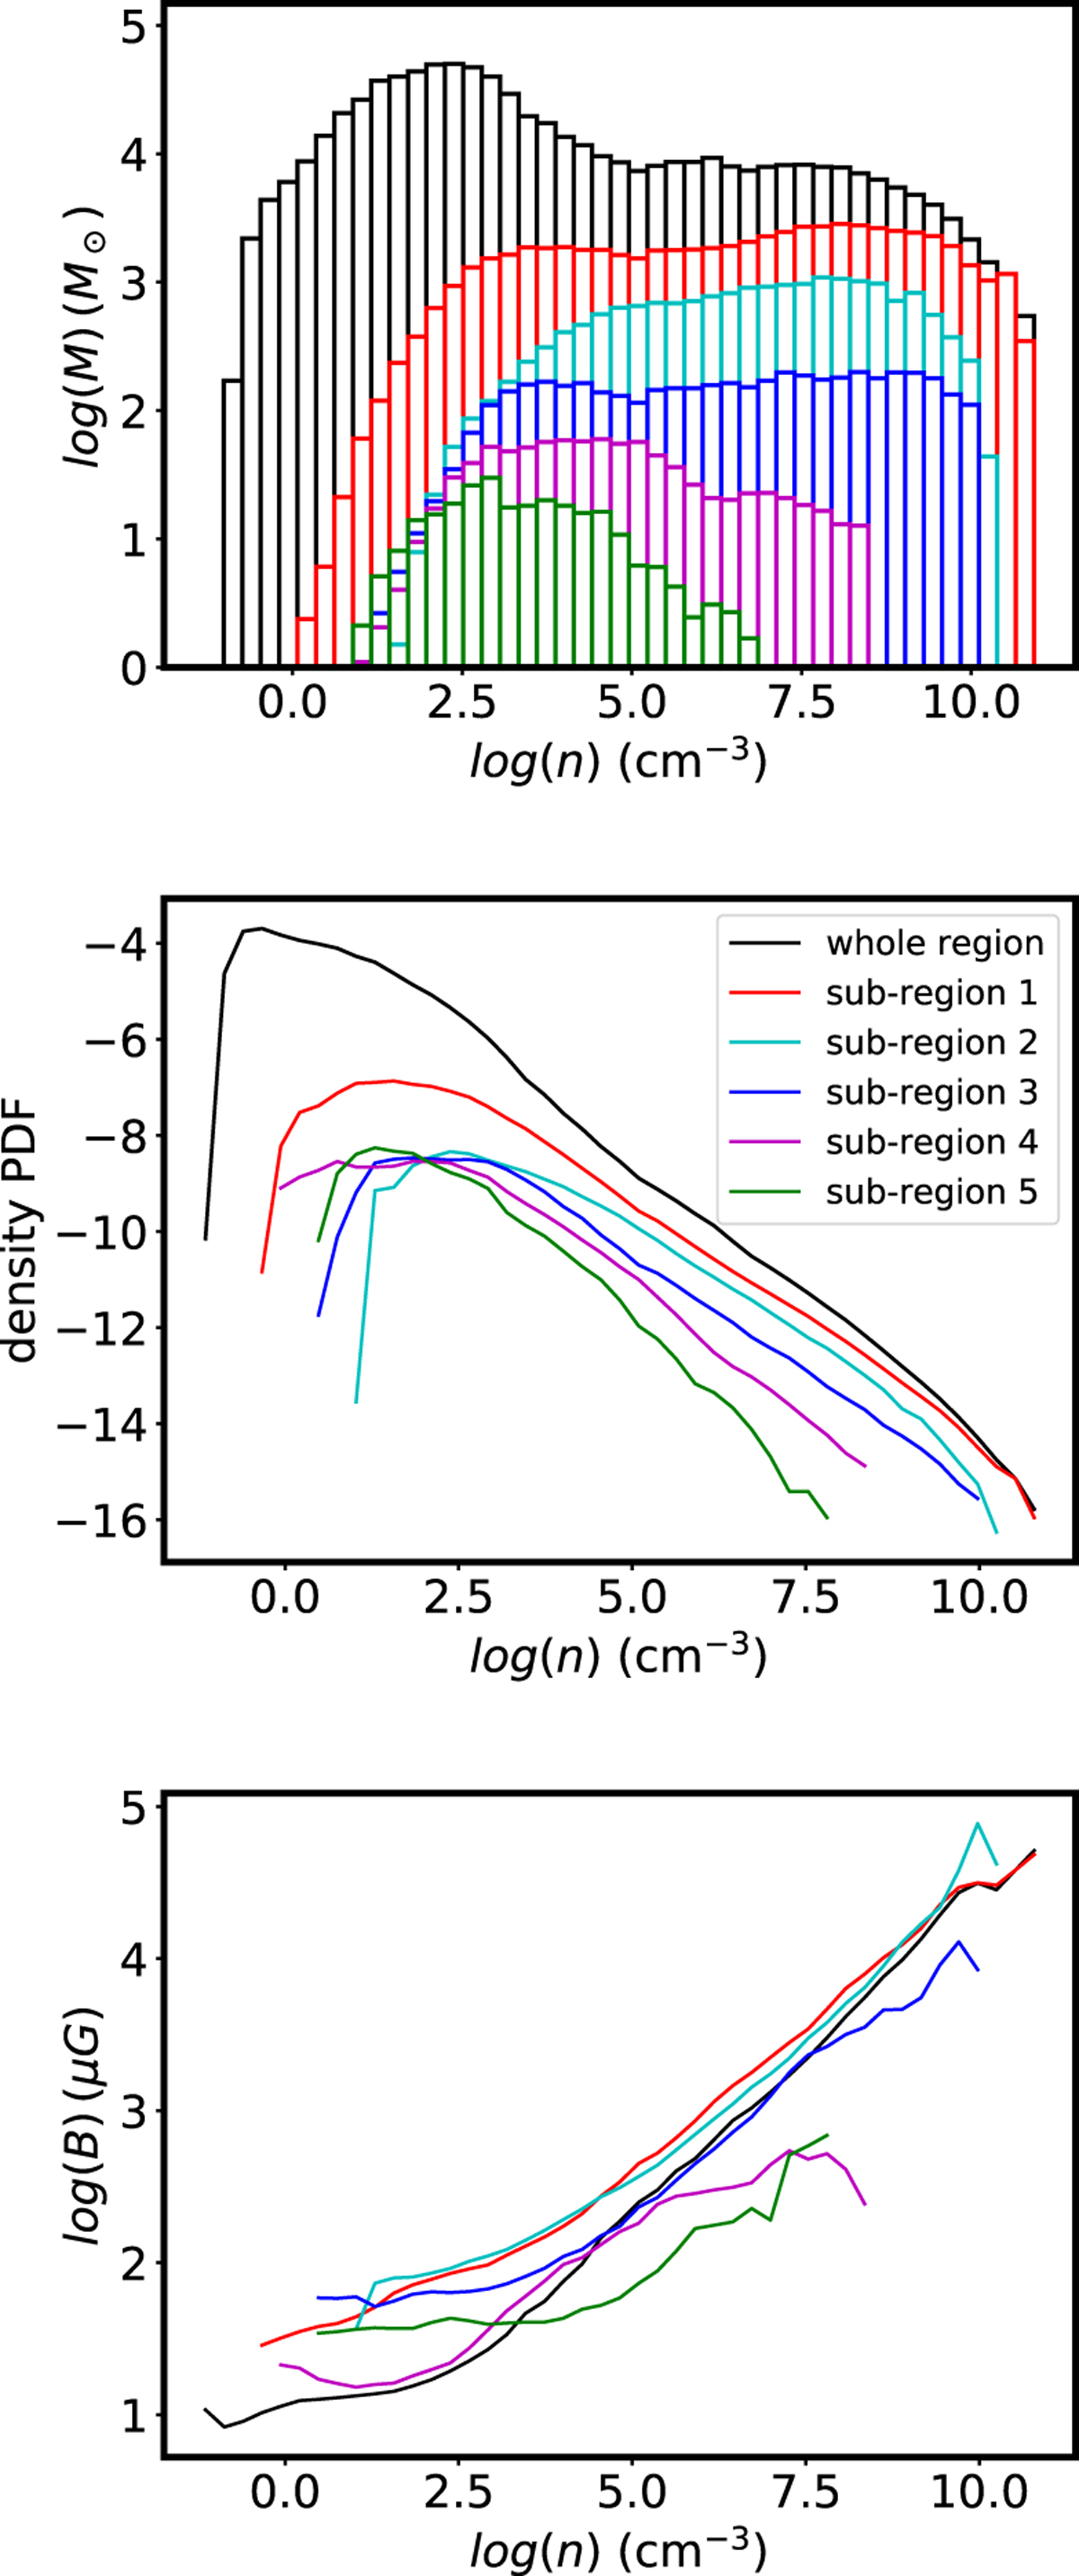
Top panel: mass distribution as a function of density (mass weighted density PDF), bottom panel: mean magnetic intensity as a function of density for the five sub-regions shown in Fig. 7.
Current usage metrics show cumulative count of Article Views (full-text article views including HTML views, PDF and ePub downloads, according to the available data) and Abstracts Views on Vision4Press platform.
Data correspond to usage on the plateform after 2015. The current usage metrics is available 48-96 hours after online publication and is updated daily on week days.
Initial download of the metrics may take a while.