Fig. 9
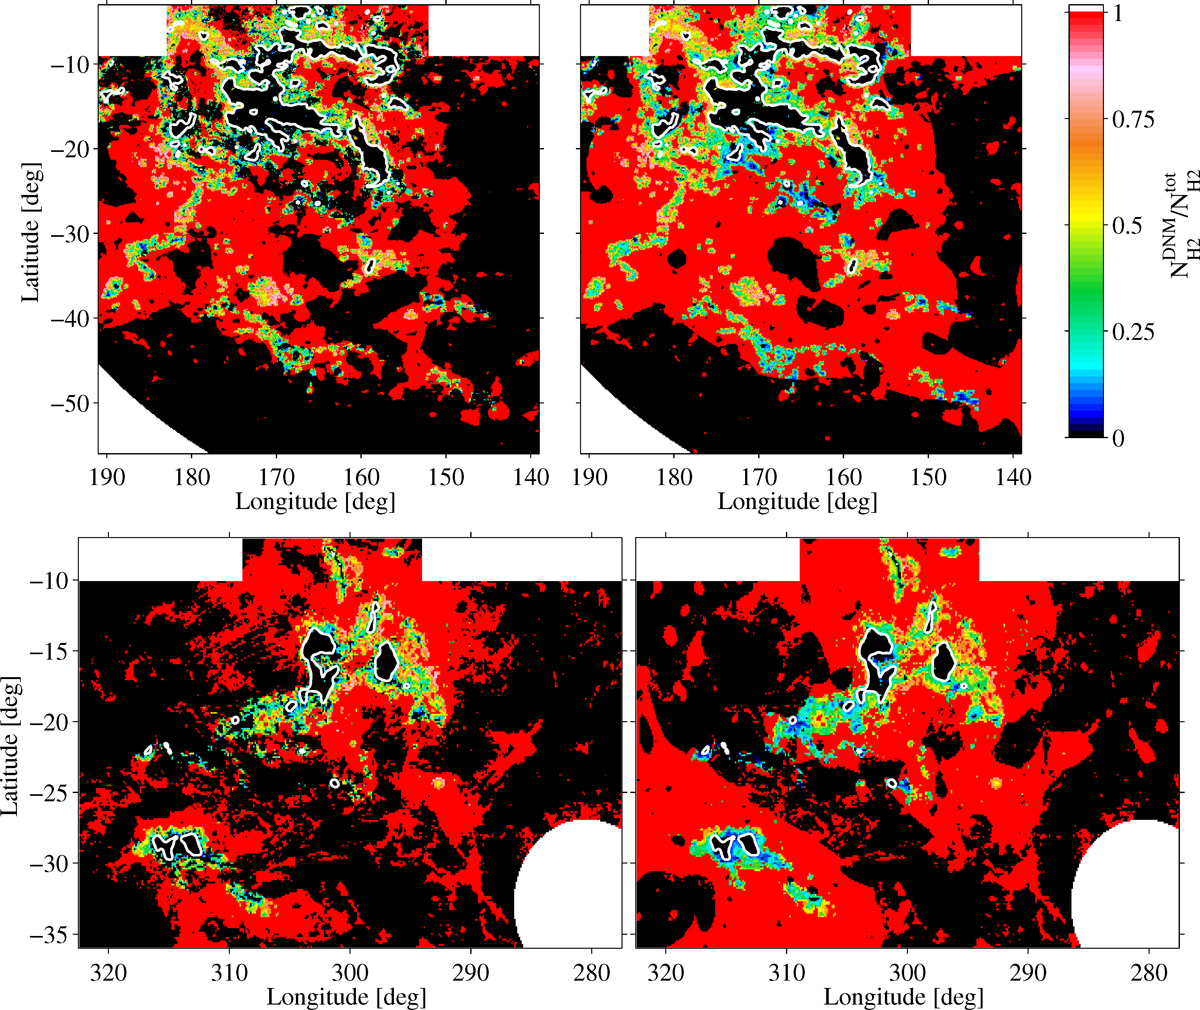
Fraction of the molecular DNM in the total H2
column-density (![]() )
derived fromthe dust (left) and γ-ray
(right) analyses for the anticentre (top) and Chamaeleon (bottom) regions. The DNM is assumed to be
50%
molecular. The white contours outline the shapes of the CO clouds at the
7 K km s−1
level chosen to separate DNM and COsat
components.
)
derived fromthe dust (left) and γ-ray
(right) analyses for the anticentre (top) and Chamaeleon (bottom) regions. The DNM is assumed to be
50%
molecular. The white contours outline the shapes of the CO clouds at the
7 K km s−1
level chosen to separate DNM and COsat
components.
Current usage metrics show cumulative count of Article Views (full-text article views including HTML views, PDF and ePub downloads, according to the available data) and Abstracts Views on Vision4Press platform.
Data correspond to usage on the plateform after 2015. The current usage metrics is available 48-96 hours after online publication and is updated daily on week days.
Initial download of the metrics may take a while.