Fig. 8
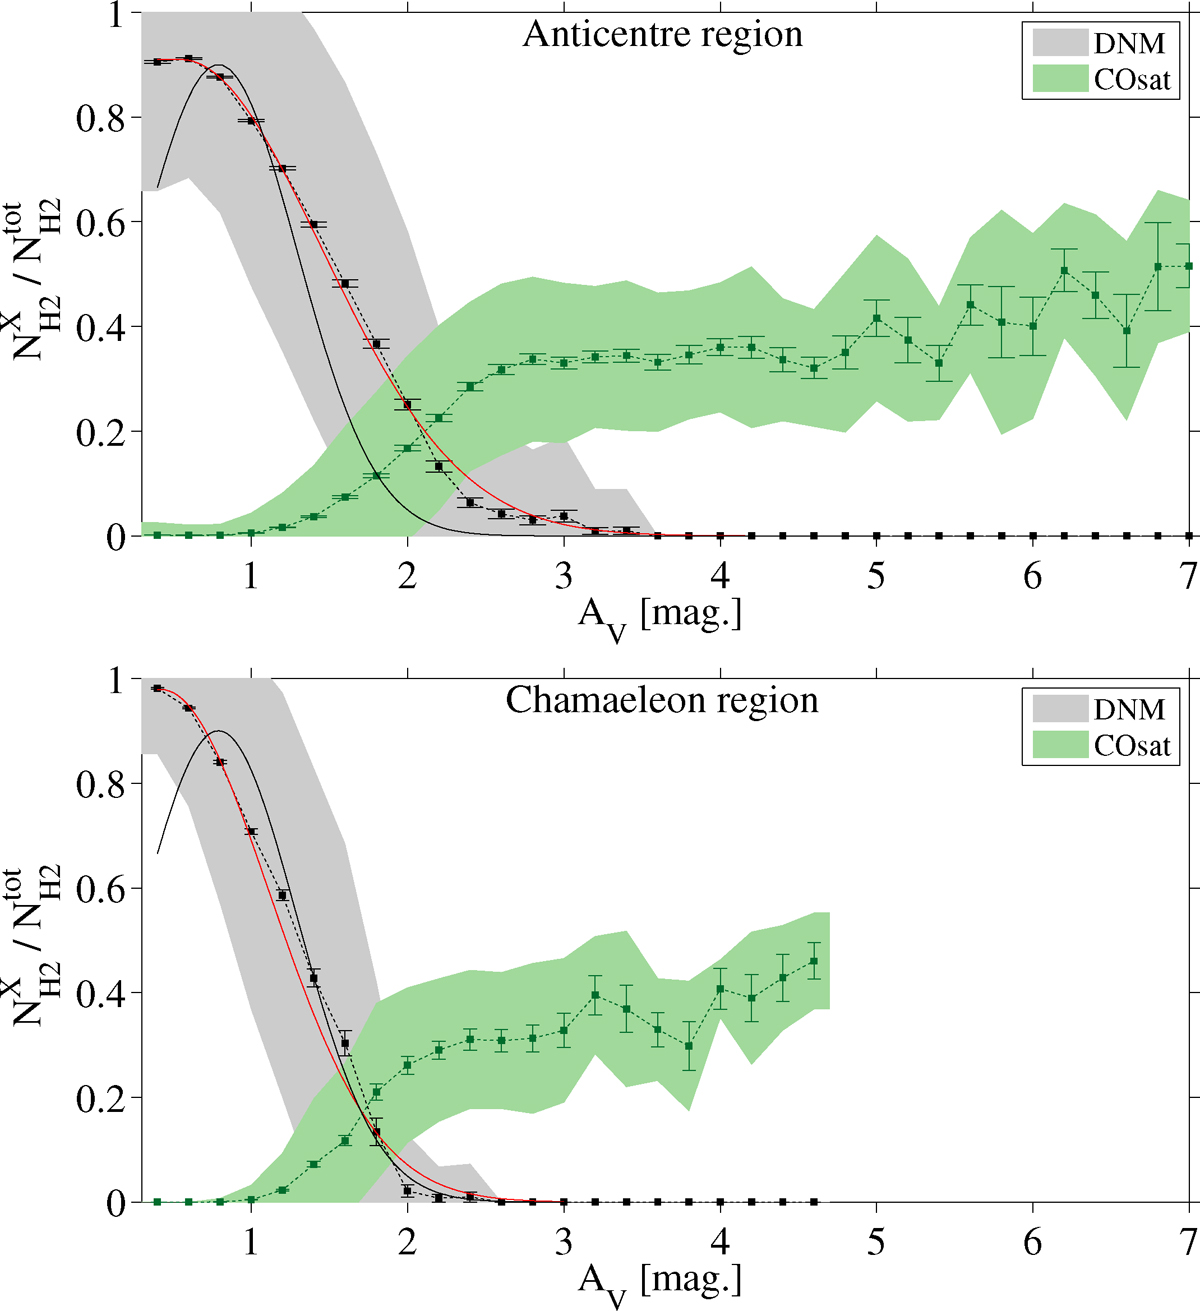
Evolution with visual extinction AV
of the fraction ![]() of molecular DNM gas (grey) or additional COsat
H2
(green) in the total H2
column-density. The DNM is assumed to be 100% molecular. The shaded areas and error bars respectively
give the standard deviation in the sample and the standard error of the mean. The black line gives
the Gaussian profile of Xu et al. (2016) and the red line shows the best fit by a half-Gaussian to the
of molecular DNM gas (grey) or additional COsat
H2
(green) in the total H2
column-density. The DNM is assumed to be 100% molecular. The shaded areas and error bars respectively
give the standard deviation in the sample and the standard error of the mean. The black line gives
the Gaussian profile of Xu et al. (2016) and the red line shows the best fit by a half-Gaussian to the
![]() fraction.
fraction.
Current usage metrics show cumulative count of Article Views (full-text article views including HTML views, PDF and ePub downloads, according to the available data) and Abstracts Views on Vision4Press platform.
Data correspond to usage on the plateform after 2015. The current usage metrics is available 48-96 hours after online publication and is updated daily on week days.
Initial download of the metrics may take a while.