Fig. 5
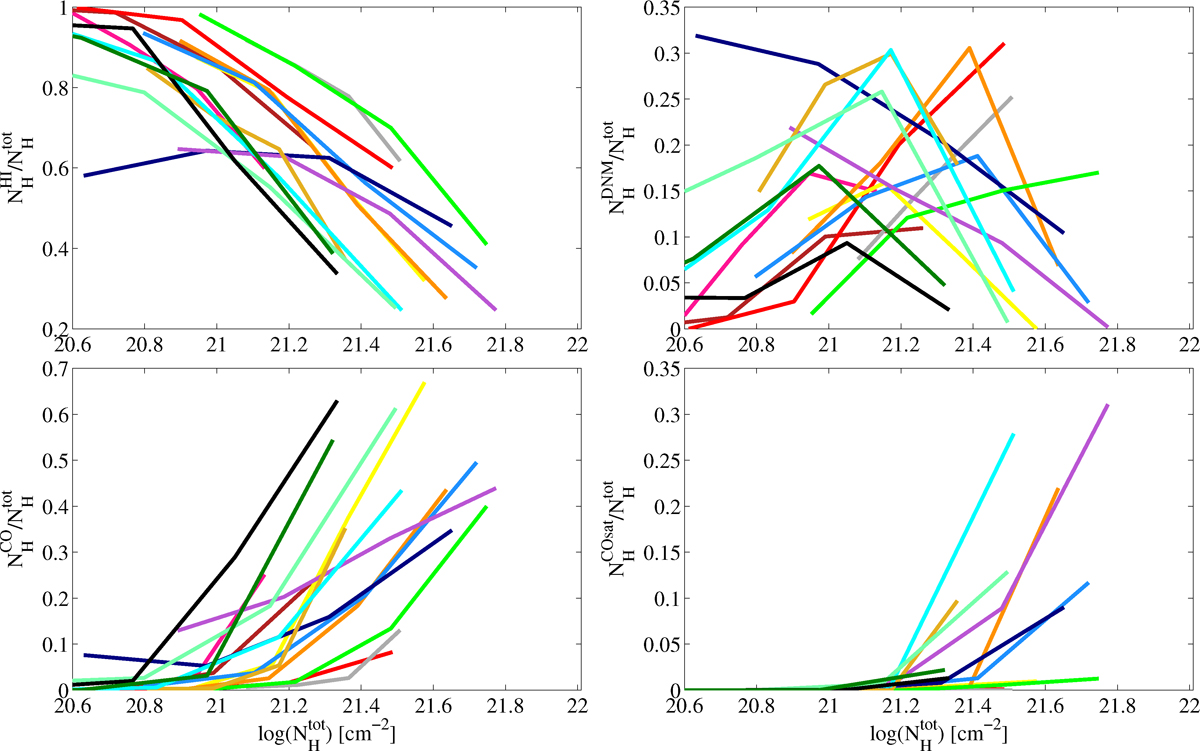
Evolution with ![]() of the fractions of the total hydrogen column density in the H I (top left), DNM (top right), CO (bottom left), and
COsat
(bottom right) components. The number of points is the same for all the curves. The points are equally spaced between
the minimum and maximum of each profile. The colours refer to the same clouds as in Fig. 1.
of the fractions of the total hydrogen column density in the H I (top left), DNM (top right), CO (bottom left), and
COsat
(bottom right) components. The number of points is the same for all the curves. The points are equally spaced between
the minimum and maximum of each profile. The colours refer to the same clouds as in Fig. 1.
Current usage metrics show cumulative count of Article Views (full-text article views including HTML views, PDF and ePub downloads, according to the available data) and Abstracts Views on Vision4Press platform.
Data correspond to usage on the plateform after 2015. The current usage metrics is available 48-96 hours after online publication and is updated daily on week days.
Initial download of the metrics may take a while.