Free Access
Fig. 4
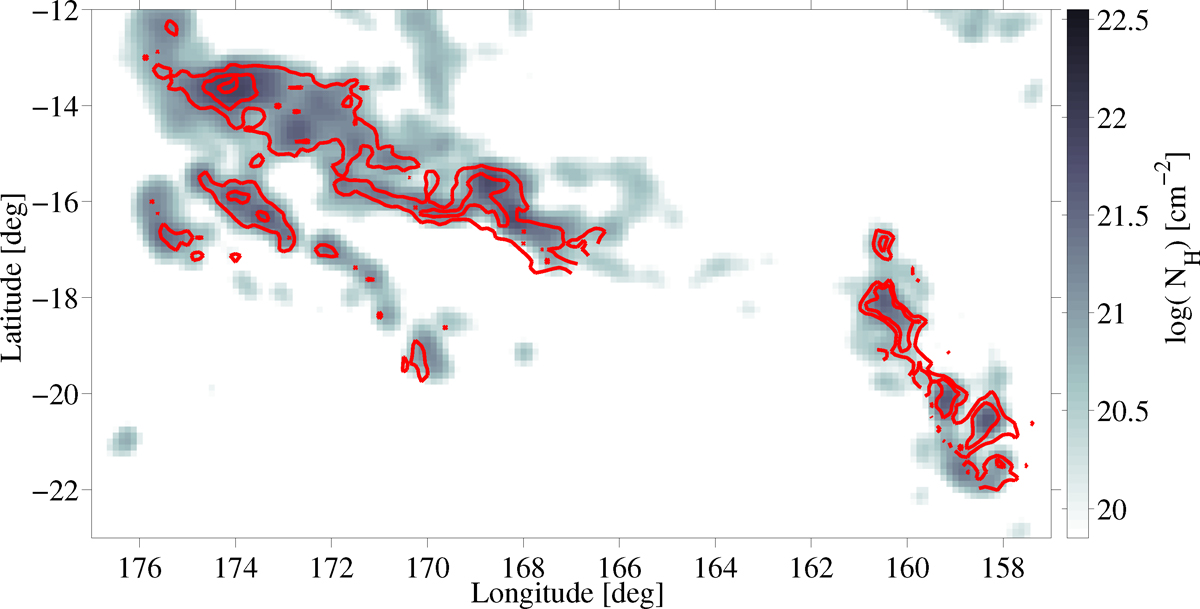
Hydrogen column density map of the COsat component from the τ353 analysis overlaid with contours of 13CO line intensities at 2 and 4 K km s−1 in the Taurus and Perseus clouds (Narayanan et al. 2008; Ridge et al. 2006).
Current usage metrics show cumulative count of Article Views (full-text article views including HTML views, PDF and ePub downloads, according to the available data) and Abstracts Views on Vision4Press platform.
Data correspond to usage on the plateform after 2015. The current usage metrics is available 48-96 hours after online publication and is updated daily on week days.
Initial download of the metrics may take a while.