Fig. 13
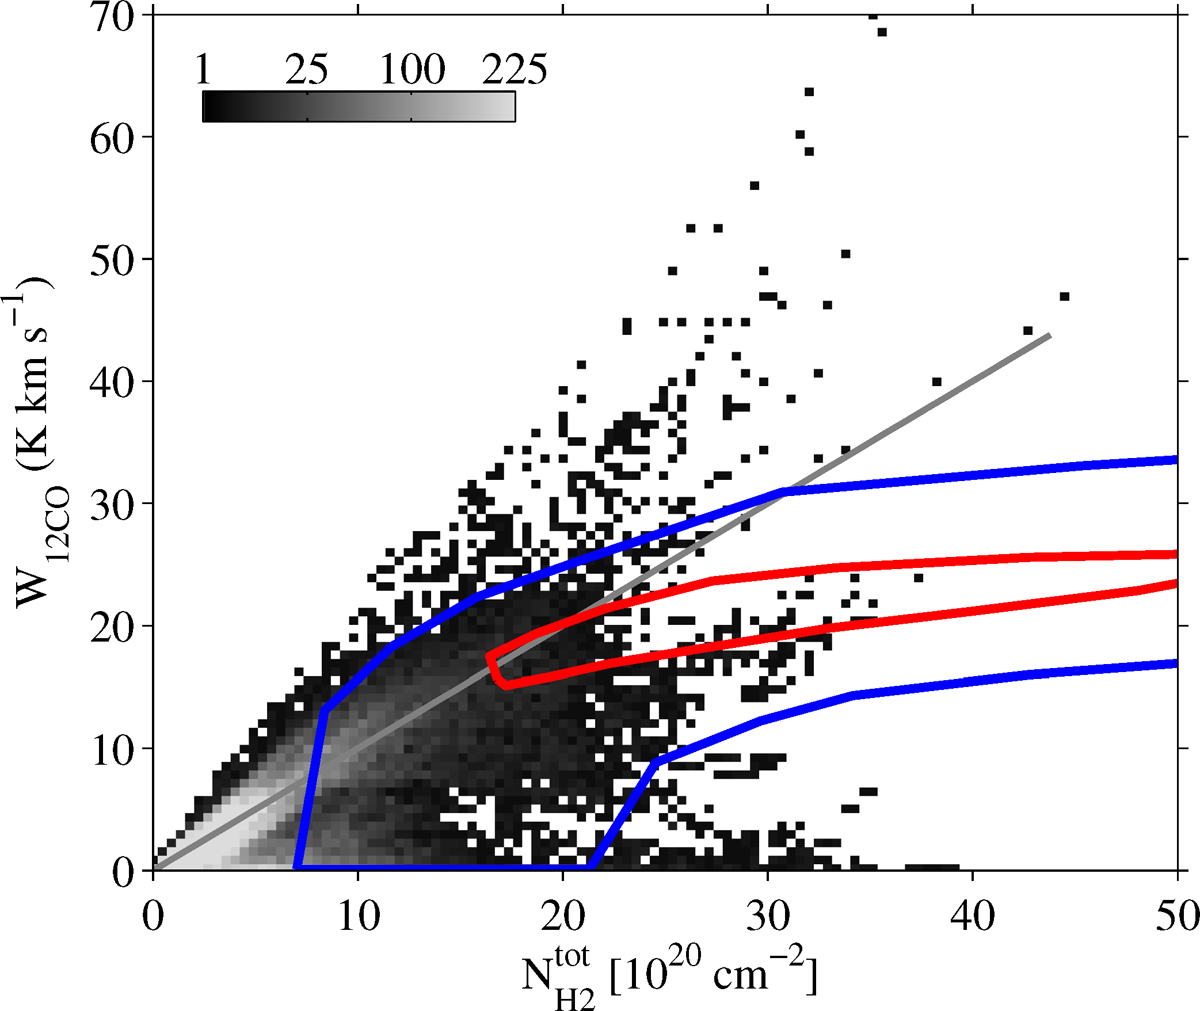
Number distribution of the integrated 12CO
intensity, WCO,
as a functionof the total H2
column-density derived from the γ-ray
fits for the anticentre and Chamaeleon regions. In each direction ![]() is the sum of
is the sum of ![]() ,
,
![]() ,
and
,
and ![]() contributions. The DNM is assumed to be 50%
molecular. We use the XCO
factors derived from γ
rays to estimate
contributions. The DNM is assumed to be 50%
molecular. We use the XCO
factors derived from γ
rays to estimate ![]() .
The grey line is an arbitrary reference corresponding to XCO = 1020 cm−2 K−1 km−1
s. The blue and red contours delimit the least and most populated parts of the distribution found in a simulation of the
Milky Way by Smith et al. (2014).
.
The grey line is an arbitrary reference corresponding to XCO = 1020 cm−2 K−1 km−1
s. The blue and red contours delimit the least and most populated parts of the distribution found in a simulation of the
Milky Way by Smith et al. (2014).
Current usage metrics show cumulative count of Article Views (full-text article views including HTML views, PDF and ePub downloads, according to the available data) and Abstracts Views on Vision4Press platform.
Data correspond to usage on the plateform after 2015. The current usage metrics is available 48-96 hours after online publication and is updated daily on week days.
Initial download of the metrics may take a while.