Fig. 8
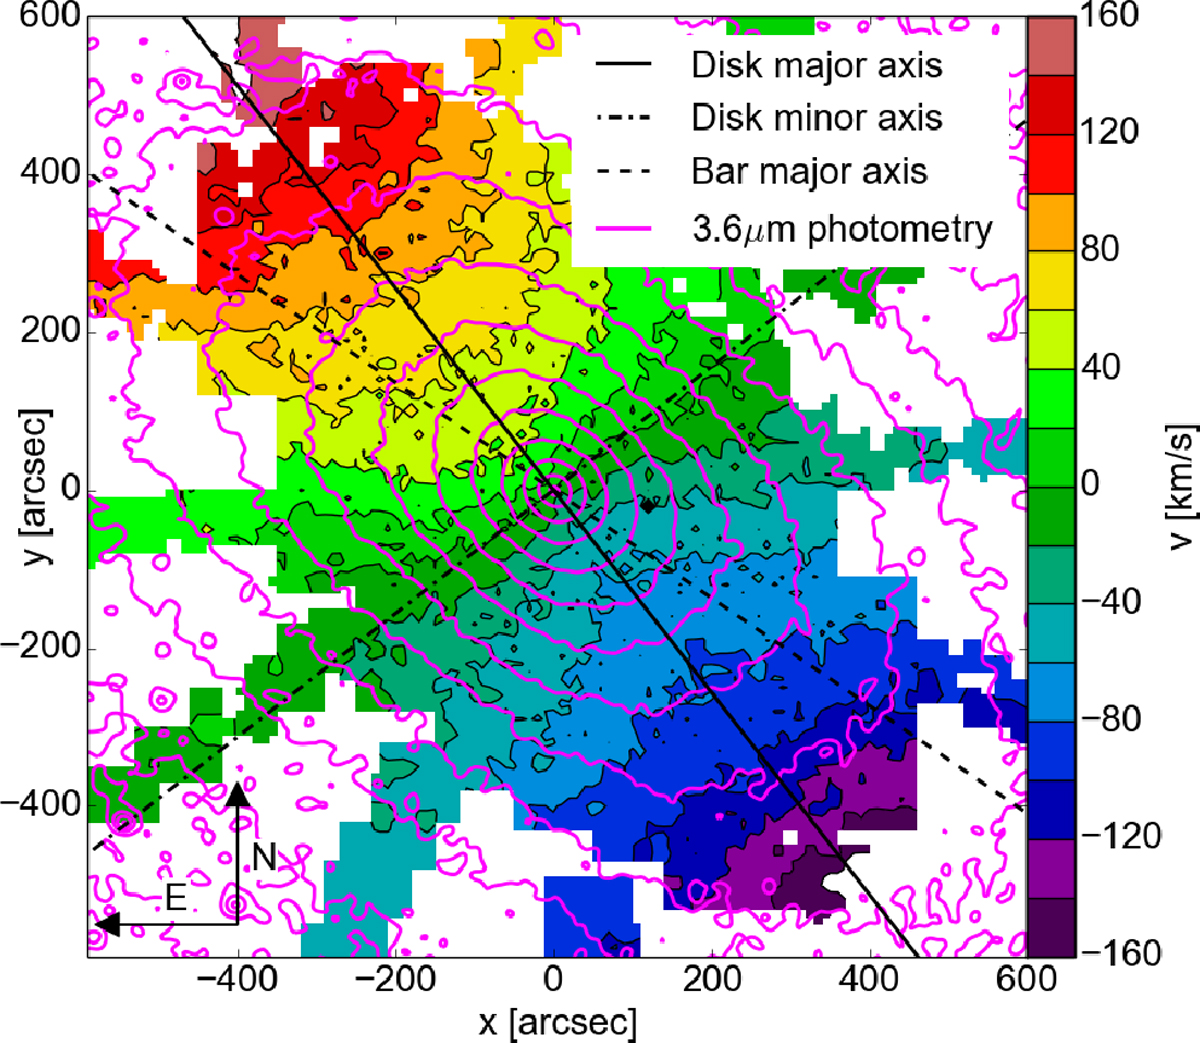
Map of the stellar velocity from Fig. 6 plotted with contours. The solid line is the disk major axis (38∘ ), the dash-dotted line the disk minor axis (128∘ ) and the dashed line is the bar major axis (55.7∘ ). The magenta contours are from the IRAC 3.6 μm image. In this visualization, the line of zero velocity shows a slight twist in the eastern half of the bulge.
Current usage metrics show cumulative count of Article Views (full-text article views including HTML views, PDF and ePub downloads, according to the available data) and Abstracts Views on Vision4Press platform.
Data correspond to usage on the plateform after 2015. The current usage metrics is available 48-96 hours after online publication and is updated daily on week days.
Initial download of the metrics may take a while.