Fig. 32
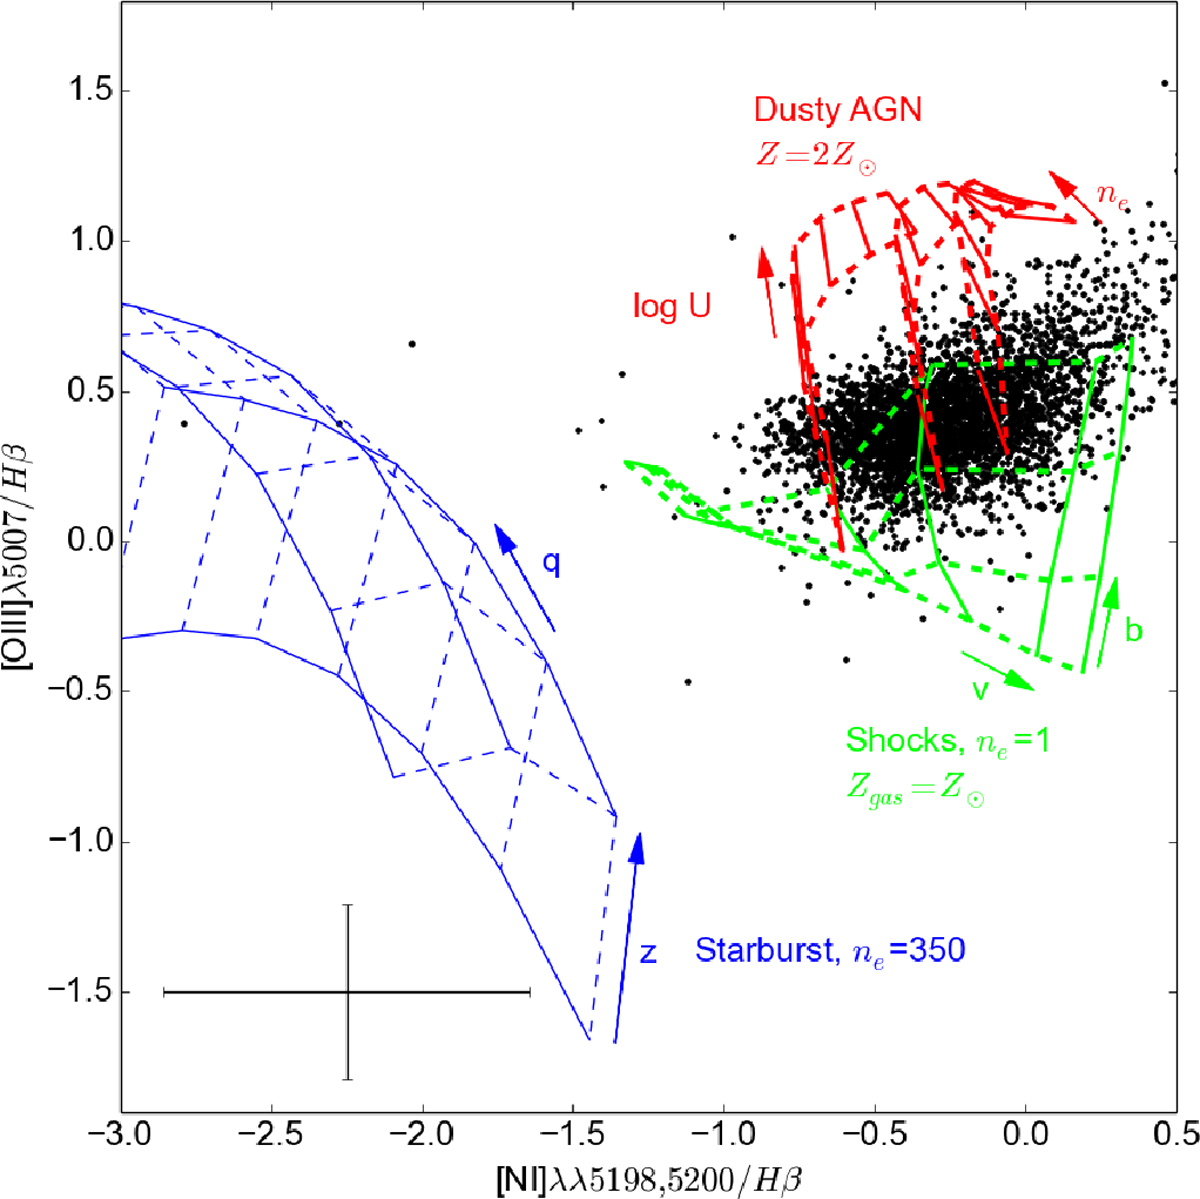
Diagnostic diagram for the first gas component. The plot is equivalent to the right panel of Fig. 1 in Sarzi et al. (2010). The black points are the values from our data. The median error values of the errorbars are shown in the lower left corner. Overplotted are lines showing the predictions for gas that is photoionized by a central active galactic nucleus (AGN), by O-stars after starbursts or by shocks, respectively. The AGN grids are from the dusty, radiation pressure-dominated models of Groves et al. (2004) and adopt three values for the index α of the power-law AGN continuum fν ∝ να, with α = −1.7, − 1.4, − 1.2 from left to right. In each AGN model grid, the solid lines trace the dimensionless ionization parameter log U (defined as logq∕c), which increases with the [O III]/Hβ ratio, assuming the values logU = −3.0, − 2.6, − 2.3, − 2.0, − 1.6, − 1.3, − 1.0, whereas the dashed lines show the adopted values for the electron density of Ne = 102 and 104 cm−3, with smaller values of the [N I]/Hβ ratio corresponding to larger Ne values. The starburst grids are from Dopita et al. (2000), and assume a gas density of Ne = 350 cm−3 and use a spectral energy distribution obtained from models from Starburst99 (Leitherer et al. 1999) for an instantaneous star formation episode. The grids assume a range of metallicity Z for both stars and gas in the starburst, shown by the solid lines for Z = 0.2, 0.4, 1.0, 2.0 Z⊙, and different values for the ionization parameter q, shown by the dashed lines for q = 0.5, 1, 2, 4, 8, 15, 30 × 107 cm s−1. The shock grids, without precursor H II region, are from Allen et al. (2008) and assume an electron density of Ne = 1 cm−3 and a solar value for the gas metallicity. The solid lines show models with increasing shock velocity v = 150, 200, 300, 500, 750, 1000 km s−1, and the dashed lines models with magnetic parameter b = 0.5, 1.0, 2.0, 4.0. The grids were obtained using the program ITERA (Groves & Allen 2010). We assumed solar metallicity for the shocks and twice solar metallicity for the dusty active galactic nucleus (AGN) grids, because we measured these values in the bulge in our stellar population measurements, which will be presented in Saglia et al. (2018).
Current usage metrics show cumulative count of Article Views (full-text article views including HTML views, PDF and ePub downloads, according to the available data) and Abstracts Views on Vision4Press platform.
Data correspond to usage on the plateform after 2015. The current usage metrics is available 48-96 hours after online publication and is updated daily on week days.
Initial download of the metrics may take a while.