Fig. 30
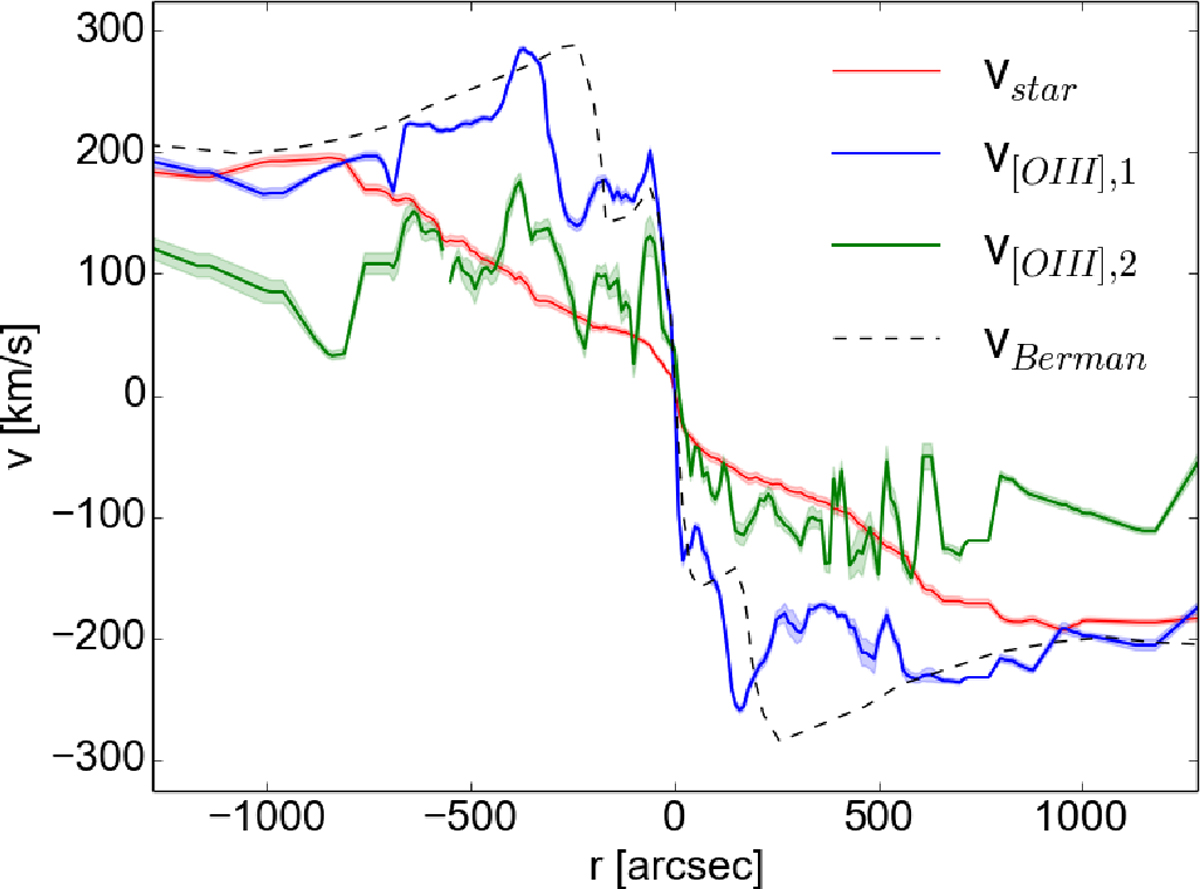
Cut through the velocity maps along the disk major axis within an aperture of 40′′ . The red line is a cut through the stellar velocity (Fig. 6), the blue one is a cut through the first velocitycomponent (Fig. 12), the green one the second velocity component (Fig. 13). The blackdashed line is the velocity for the triaxial bar model by Berman (2001).
Current usage metrics show cumulative count of Article Views (full-text article views including HTML views, PDF and ePub downloads, according to the available data) and Abstracts Views on Vision4Press platform.
Data correspond to usage on the plateform after 2015. The current usage metrics is available 48-96 hours after online publication and is updated daily on week days.
Initial download of the metrics may take a while.