Fig. 29
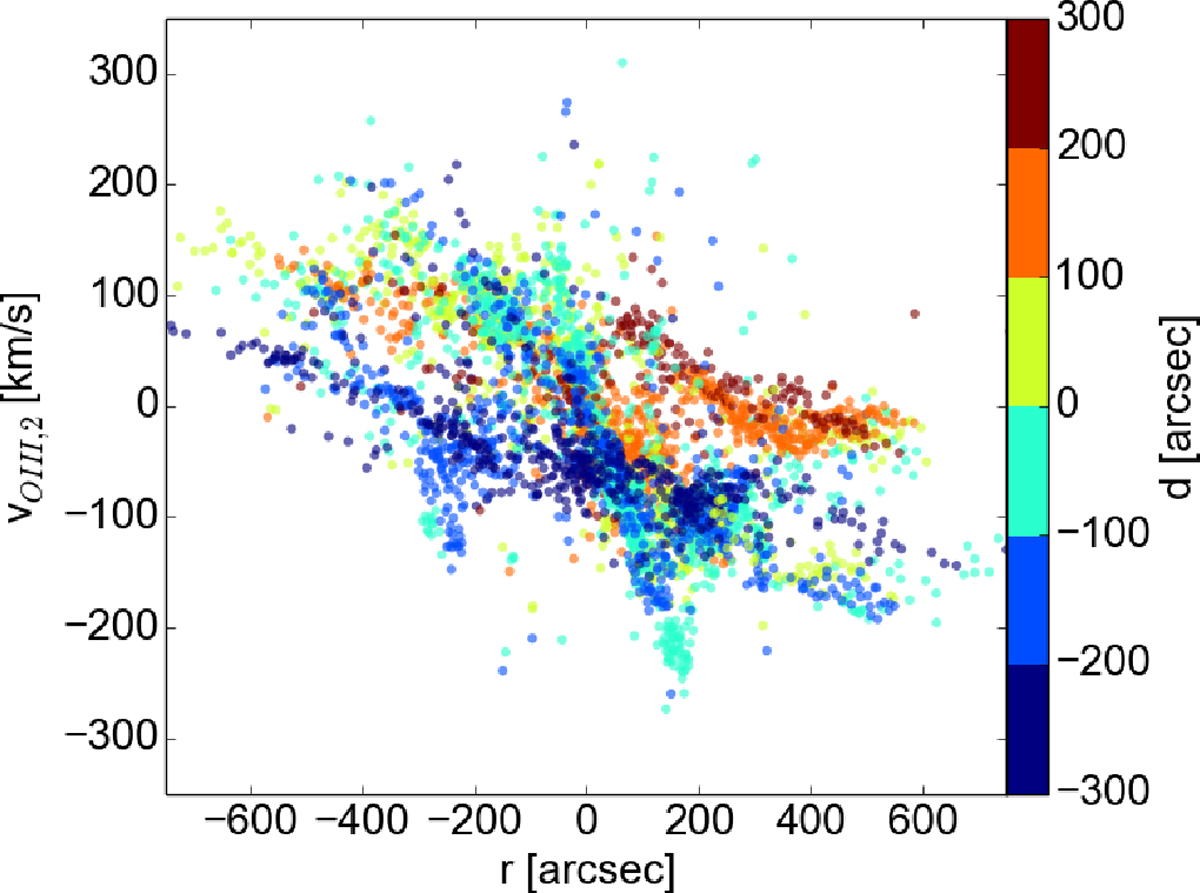
Position-velocity diagram of the second gas component projected onto the disk major axis. Theplot is analogous to Fig. 28. The orange and red points between 0′′ < r < 500′′ , 0 km s−1 < v < 100 km −1 and 100′′ < d < 200′′ correspond to the arm of zero velocity visible in Fig. 13. To the left of the center, there is an almost flat band of negative velocities, this is the zone of approaching velocities on the eastern side of the bulge in Fig. 13.
Current usage metrics show cumulative count of Article Views (full-text article views including HTML views, PDF and ePub downloads, according to the available data) and Abstracts Views on Vision4Press platform.
Data correspond to usage on the plateform after 2015. The current usage metrics is available 48-96 hours after online publication and is updated daily on week days.
Initial download of the metrics may take a while.