Fig. 28
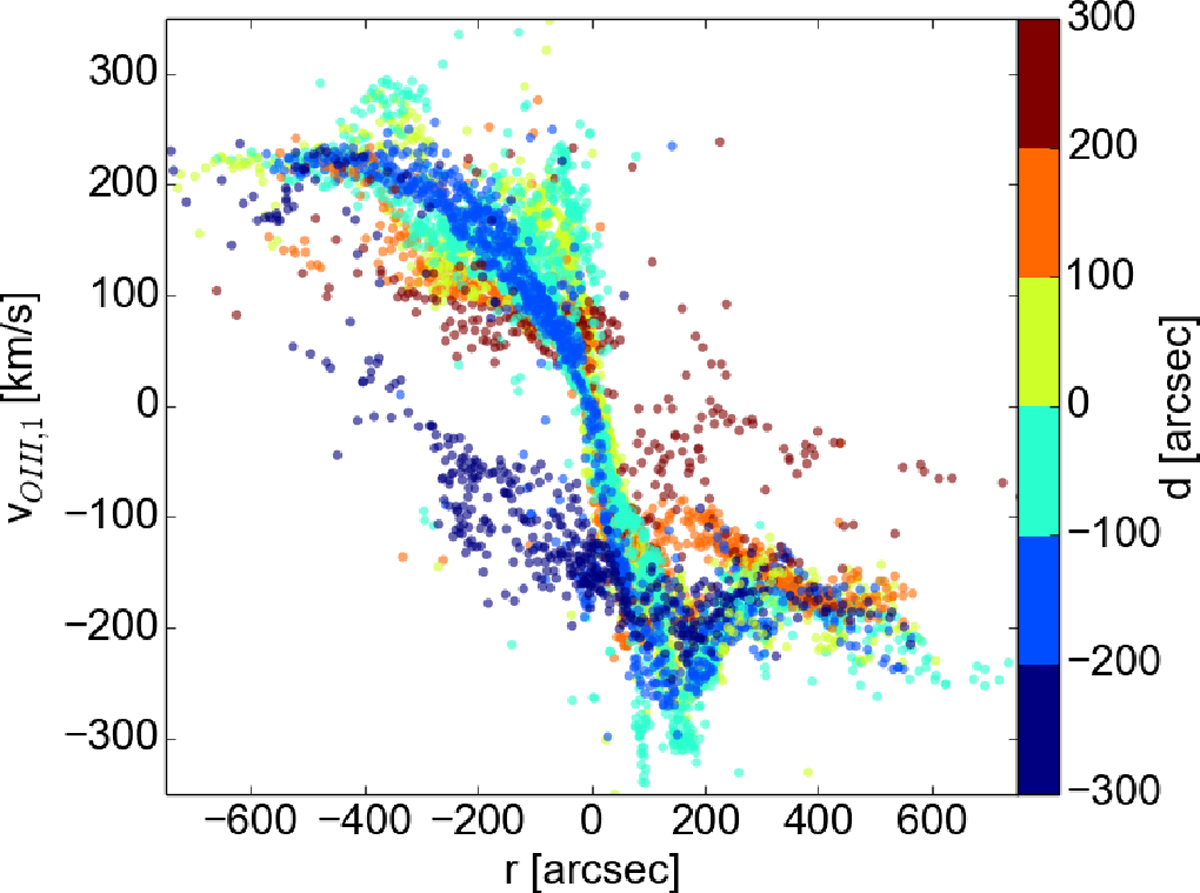
Position-velocity diagram of the first componentprojected onto the disk major axis at PA = 38∘, the x-axis is the distance along the major axis, the y-axis is the velocity and the color represents the perpendicular distance to the major axis. Values on the far side of the major axis are shown in blue, values on the near side in red.
Current usage metrics show cumulative count of Article Views (full-text article views including HTML views, PDF and ePub downloads, according to the available data) and Abstracts Views on Vision4Press platform.
Data correspond to usage on the plateform after 2015. The current usage metrics is available 48-96 hours after online publication and is updated daily on week days.
Initial download of the metrics may take a while.