Open Access
Fig. 27
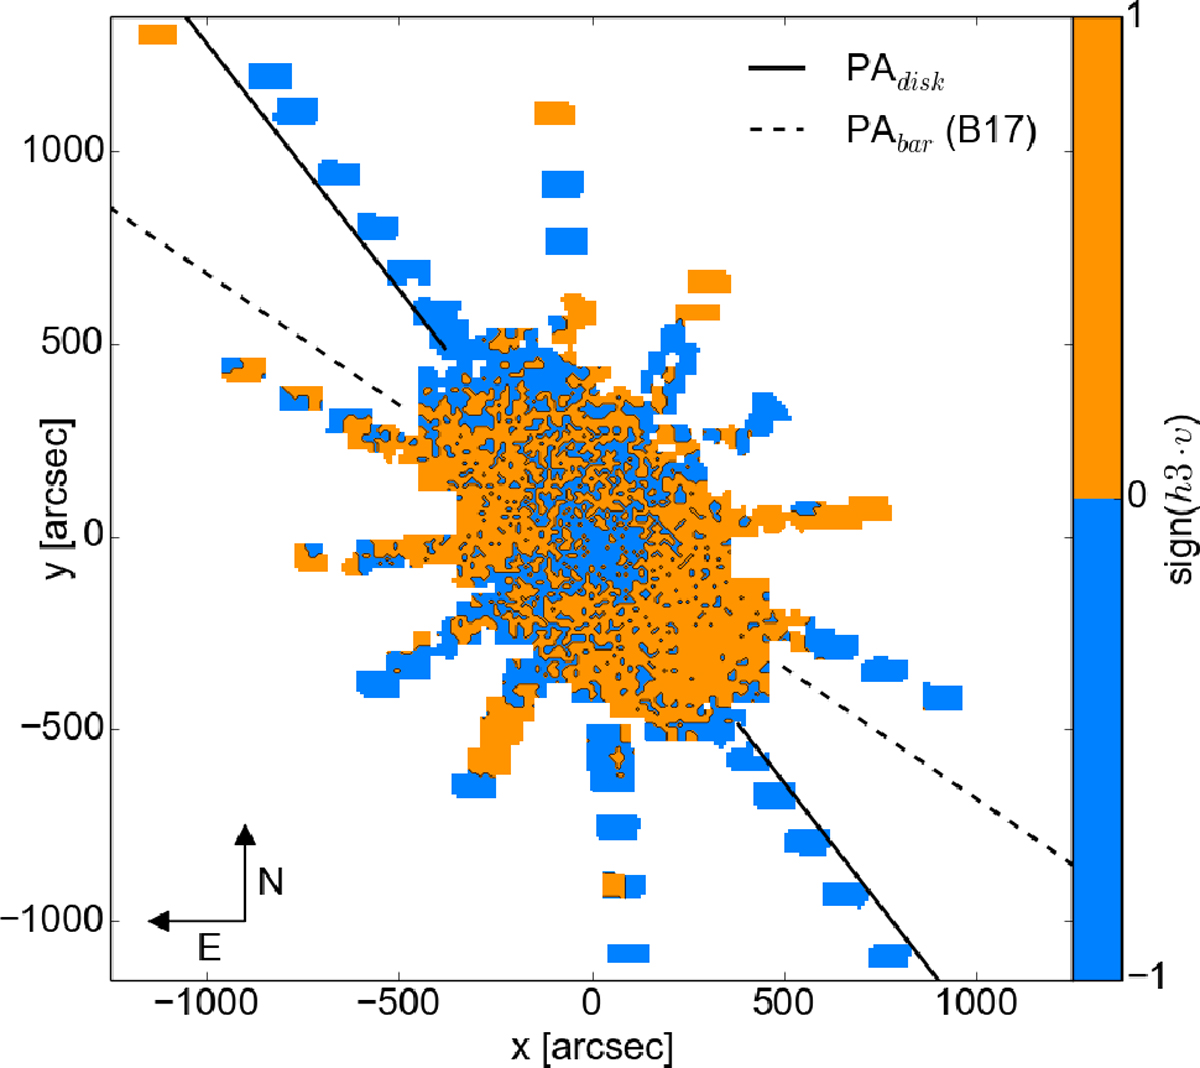
Correlation between the stellar velocity and h3. Plotted is sign(h3 ⋅ v), with the disk and bar major axis from Fig. 9. The color blue represents where the two quantities are anti-correlated, while in orange areas, they are correlated.
Current usage metrics show cumulative count of Article Views (full-text article views including HTML views, PDF and ePub downloads, according to the available data) and Abstracts Views on Vision4Press platform.
Data correspond to usage on the plateform after 2015. The current usage metrics is available 48-96 hours after online publication and is updated daily on week days.
Initial download of the metrics may take a while.