Open Access
Fig. 26
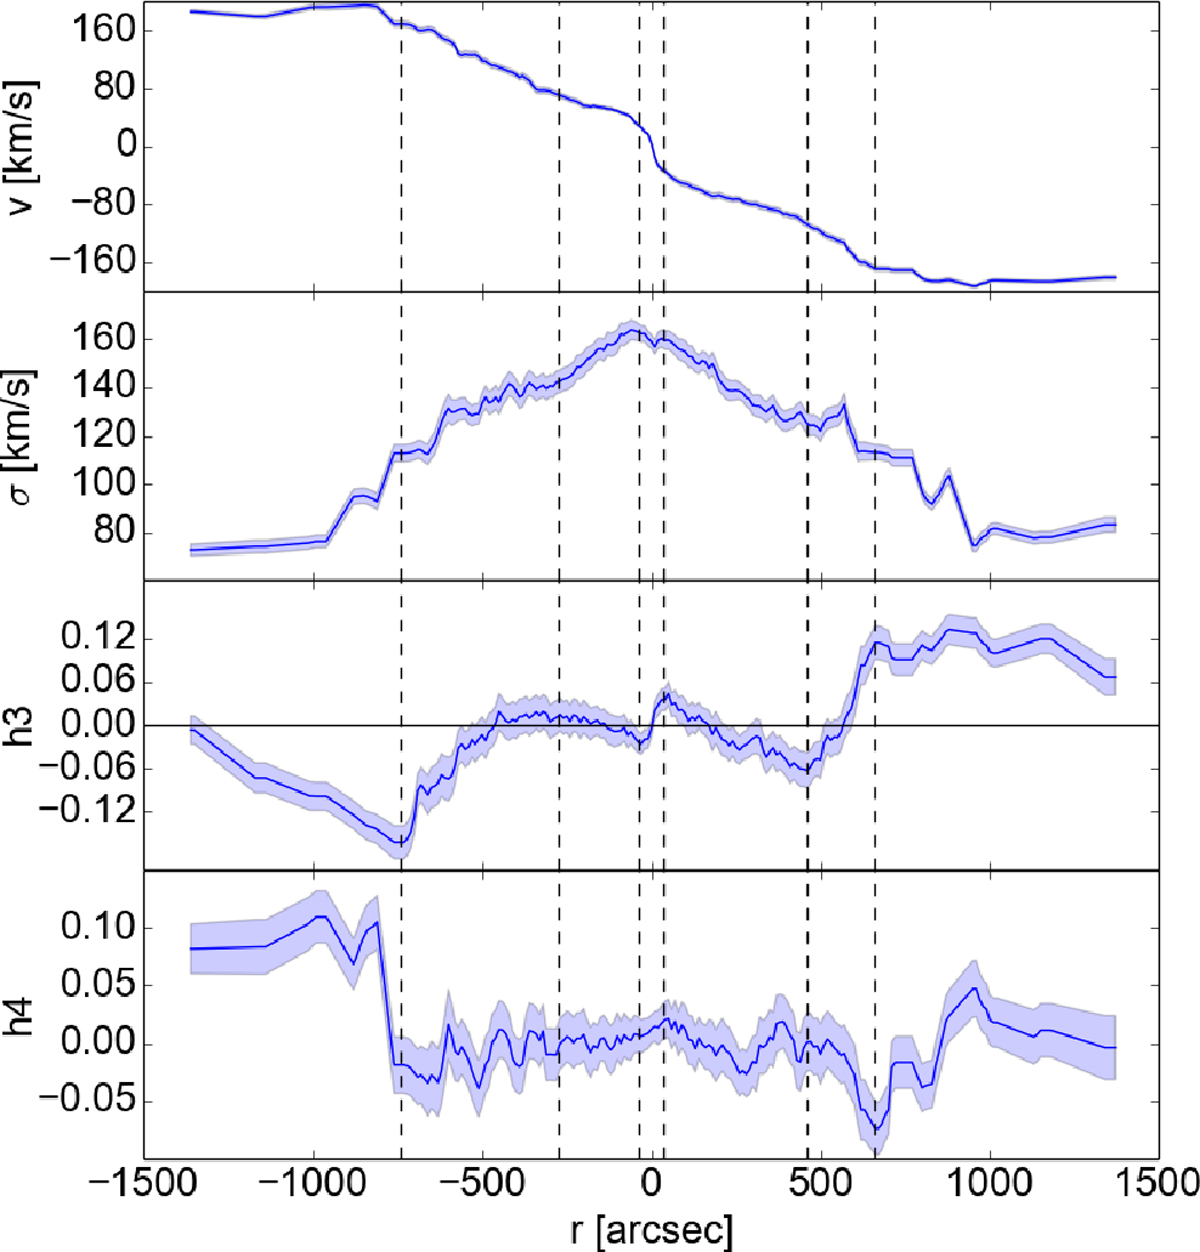
Cuts through the stellar kinematic maps from VIRUS-W along the disk major axis (PA = 38∘). In the third panel, the horizontal line is h3 = 0. The vertical dashed lines highlight the position where h3 has a local maximum or minimum.
Current usage metrics show cumulative count of Article Views (full-text article views including HTML views, PDF and ePub downloads, according to the available data) and Abstracts Views on Vision4Press platform.
Data correspond to usage on the plateform after 2015. The current usage metrics is available 48-96 hours after online publication and is updated daily on week days.
Initial download of the metrics may take a while.