Fig. 25
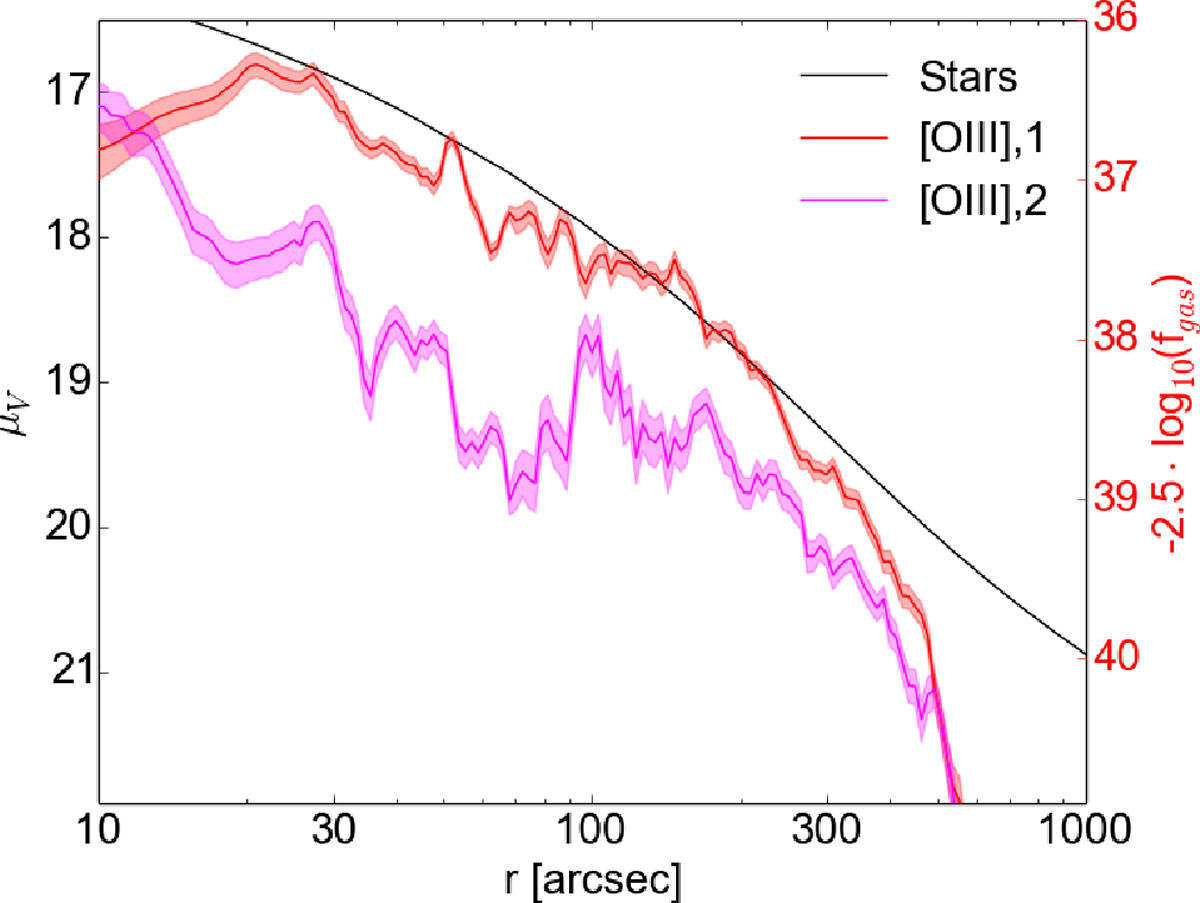
Comparison of the surface brightness of the stars (black) taken from Kormendy & Bender (1999) with ellipse fits to the fluxes of the first [O III] component (red) and the second [O III] component (magenta).The left y-axis is valid for the stellar surface brightness, the one on the right for the fluxes of the two gas components. The scales have been adjusted sothat the profiles for the stars and the first [O III] component can be compared easily.
Current usage metrics show cumulative count of Article Views (full-text article views including HTML views, PDF and ePub downloads, according to the available data) and Abstracts Views on Vision4Press platform.
Data correspond to usage on the plateform after 2015. The current usage metrics is available 48-96 hours after online publication and is updated daily on week days.
Initial download of the metrics may take a while.