Fig. 2
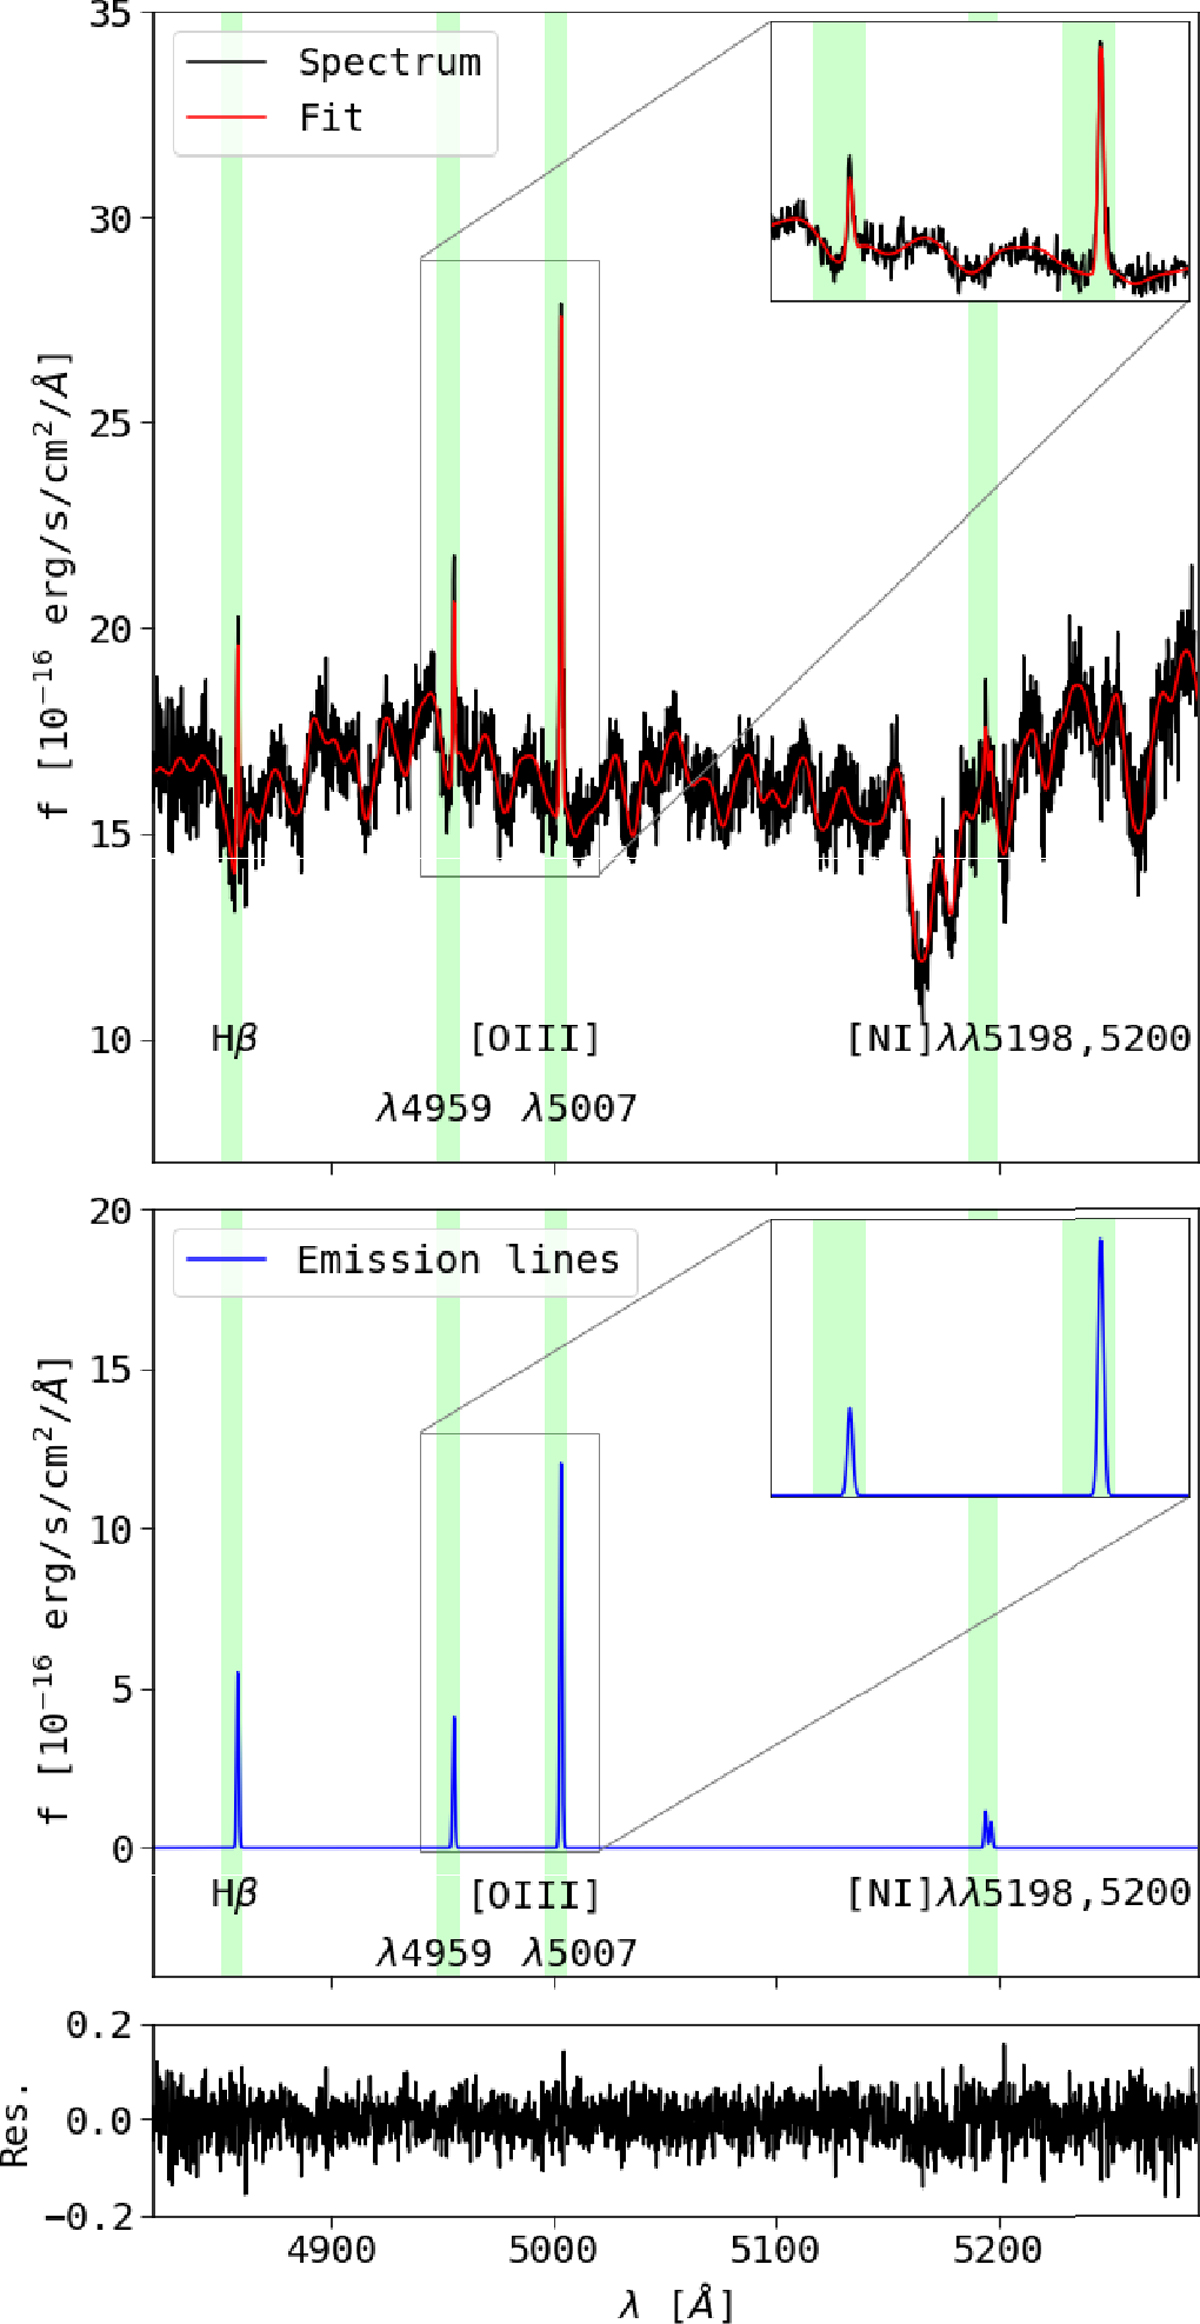
Spectrum from the bulge region with the fit by GANDALF. Top: flux-corrected spectrum (black), best fit by GANDALF (red), which is the sum of the model stellar and the emission line spectra. The green shaded areas are the regions where the emission lines are expected. A zoom into the region of the [O III] doublet is shown on the right. Middle: best fit emission lines with a zoom into the region of the [O III] doublet. Bottom: residuals (fmeasured − ffitted)/fmeasured.
Current usage metrics show cumulative count of Article Views (full-text article views including HTML views, PDF and ePub downloads, according to the available data) and Abstracts Views on Vision4Press platform.
Data correspond to usage on the plateform after 2015. The current usage metrics is available 48-96 hours after online publication and is updated daily on week days.
Initial download of the metrics may take a while.