Fig. 12
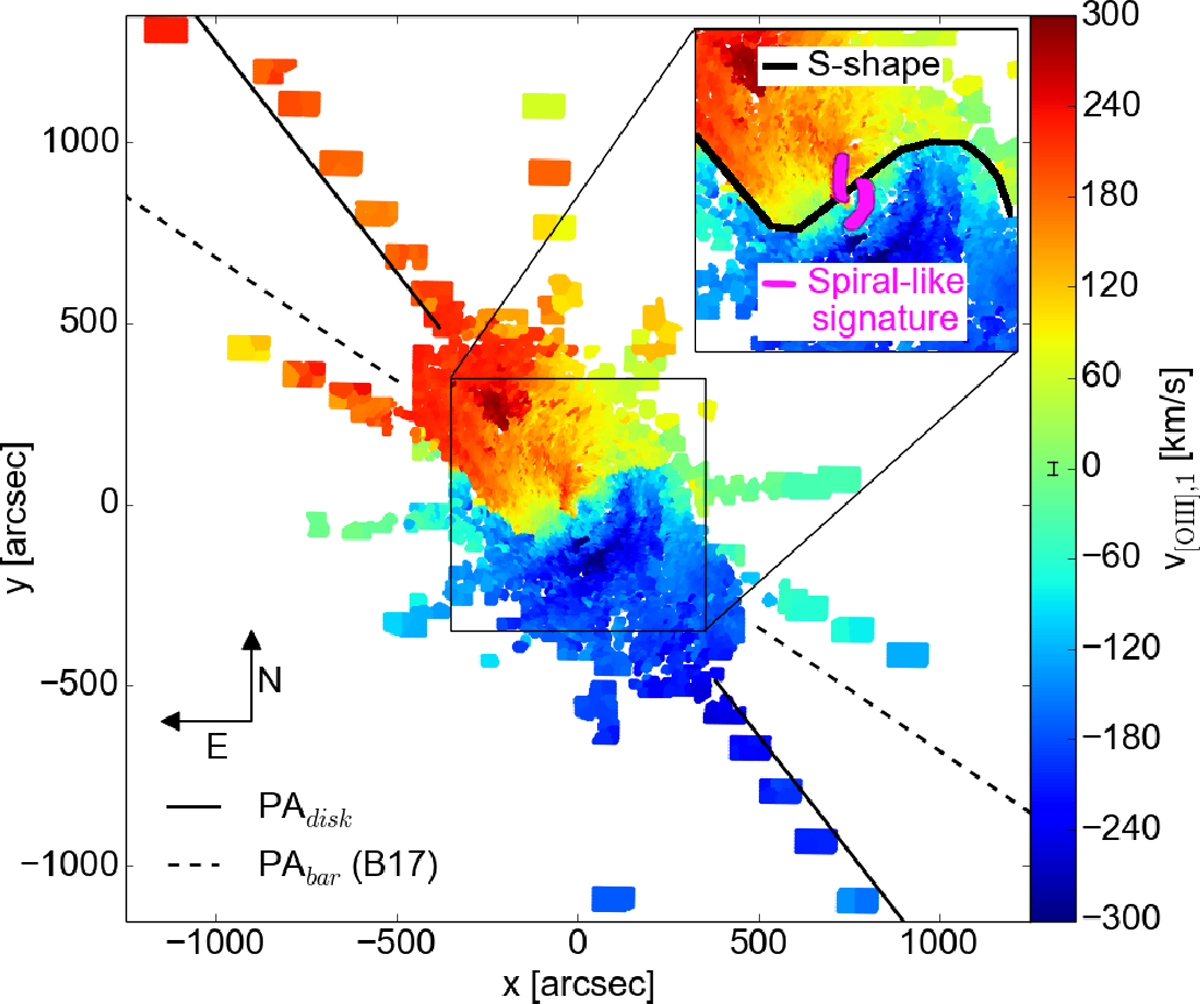
Velocity map of the more rapidly rotating first gas component. The lines are analogous to Fig. 9. The inset shows a zoom into the inner regions, with the S-shape highlighted along the line with systemic velocity. The spiral-like signature is highlighted with the magenta line, which encompasses both arms of the spiral. Both these structures are mentioned in the text.
Current usage metrics show cumulative count of Article Views (full-text article views including HTML views, PDF and ePub downloads, according to the available data) and Abstracts Views on Vision4Press platform.
Data correspond to usage on the plateform after 2015. The current usage metrics is available 48-96 hours after online publication and is updated daily on week days.
Initial download of the metrics may take a while.