Fig. 8
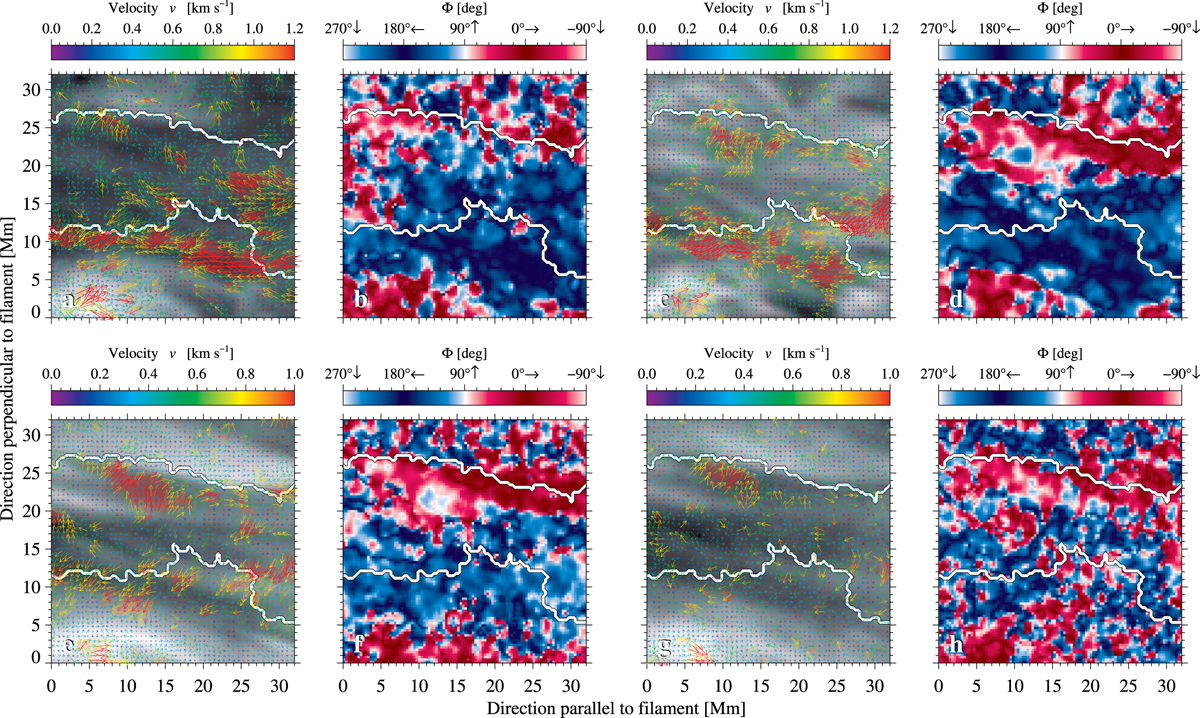
Validation of counter-streaming flows: (a, b) λ304 Å, (c, d) λ171 Å, (e, f) λ193 Å, and (g, h) λ211 Å. We show a region of 32 Mm × 32 Mm (region B in Fig. 4). The left images (a, c, e, and g) show the summed image of each wavelength over the two-hour time series superposed with the horizontal velocity vectors derived with LCT. The right images (b, d, f, and h) display a map of the angle Φ , which indicates the direction of the velocity vector (left is shown in blue and right in red). The white contour outlines the filament as seen in Hα.
Current usage metrics show cumulative count of Article Views (full-text article views including HTML views, PDF and ePub downloads, according to the available data) and Abstracts Views on Vision4Press platform.
Data correspond to usage on the plateform after 2015. The current usage metrics is available 48-96 hours after online publication and is updated daily on week days.
Initial download of the metrics may take a while.