Fig. 6
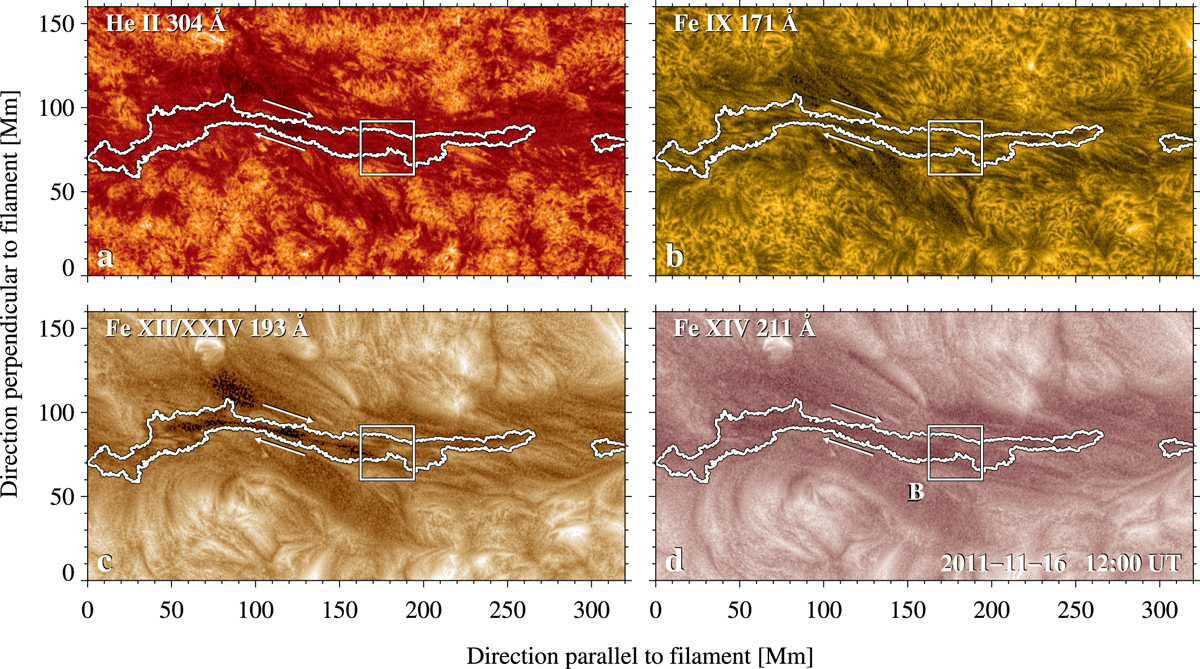
NAFE contrast enhanced images (region A with a size of 320 Mm × 160 Mm) of different AIA wavelengths at 12:00 UT on November 16: (a) λ304 Å, (b) λ171 Å, (c) λ193 Å, and (d) λ211 Å. We detect the counter-streaming flows in the time-lapse movies of the high-cadence data set (see online movie). The white square (region B) outlines the 32 Mm × 32 Mm region to which we apply LCT to track the counter-streaming flows (Fig. 8). The white arrows show location and direction of the counter-streaming flows along the spine. The white contour encloses the location of the filament’s spine in Hα.
Current usage metrics show cumulative count of Article Views (full-text article views including HTML views, PDF and ePub downloads, according to the available data) and Abstracts Views on Vision4Press platform.
Data correspond to usage on the plateform after 2015. The current usage metrics is available 48-96 hours after online publication and is updated daily on week days.
Initial download of the metrics may take a while.