Fig. 4
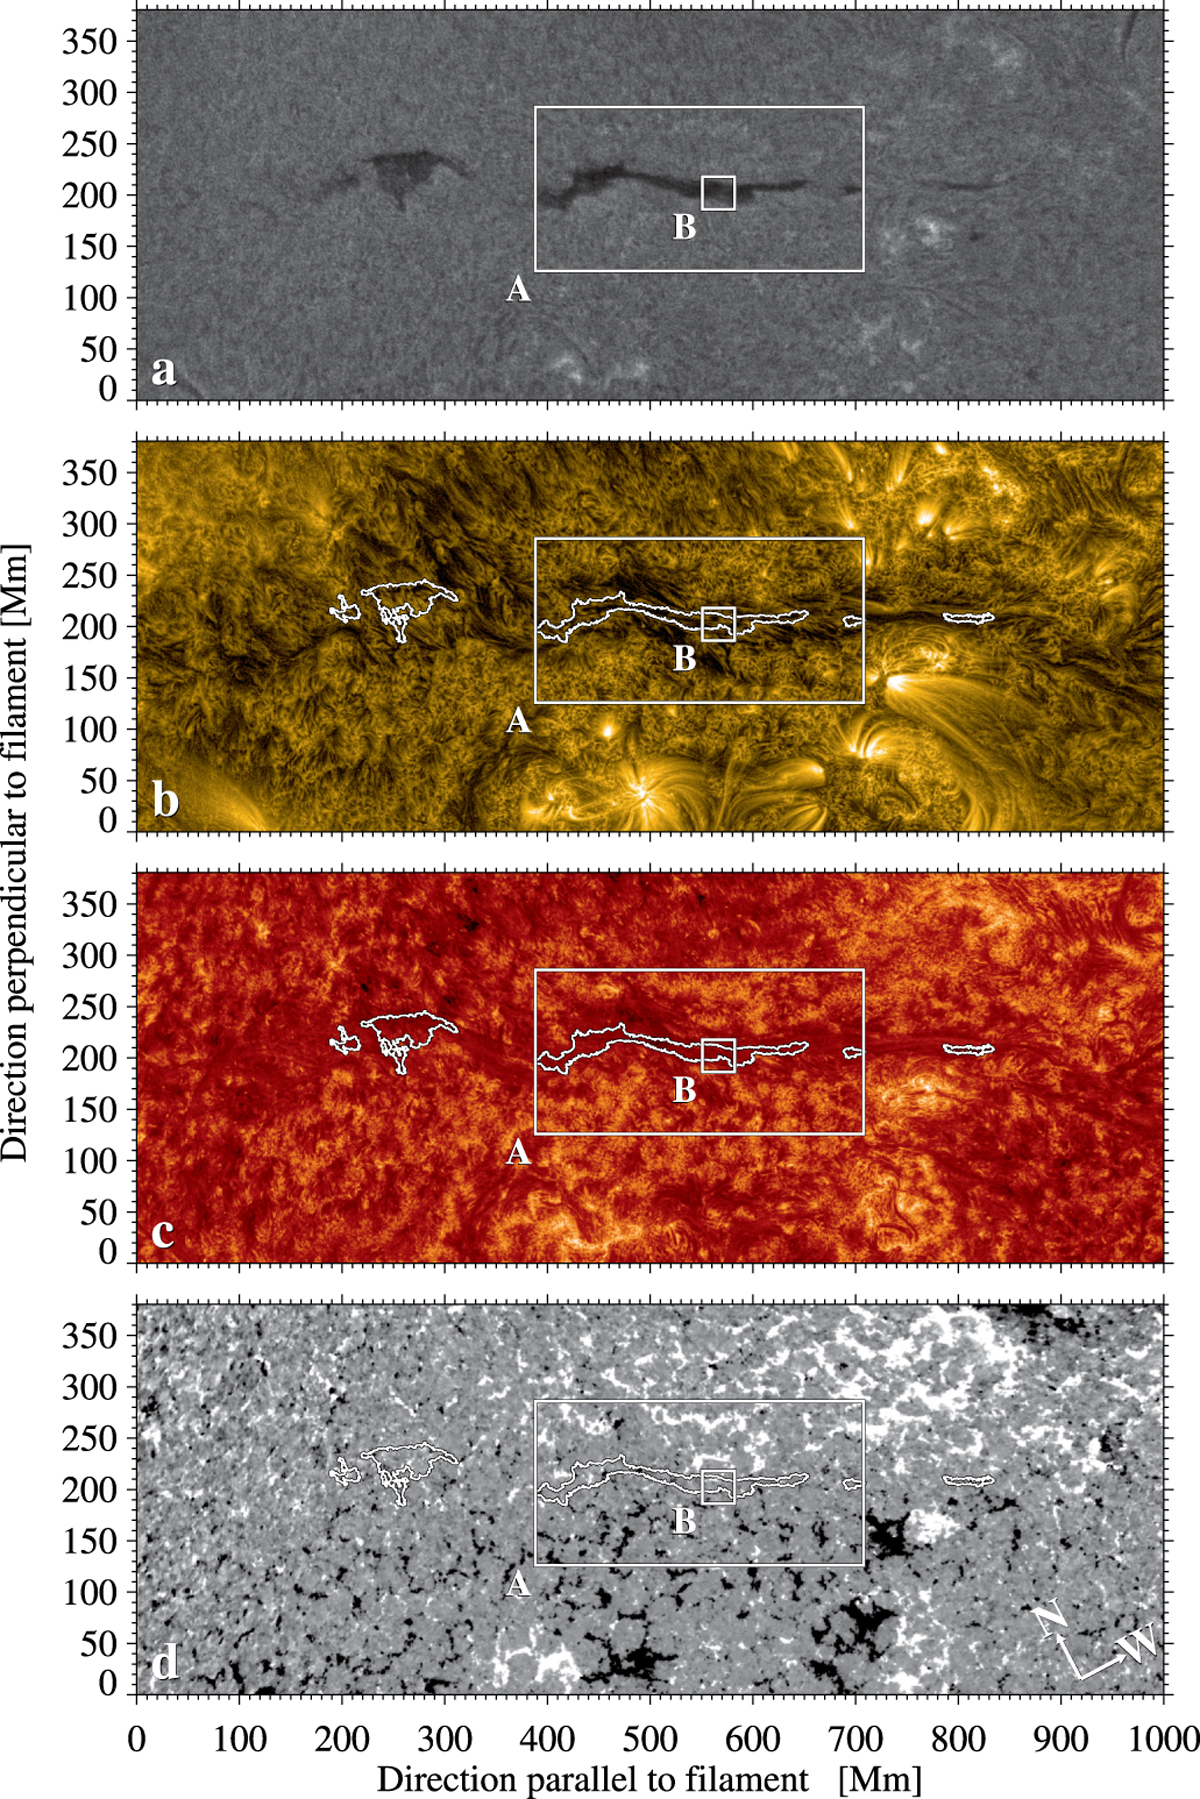
The filament at 12:00 UT on November 16. From top to bottom: (a) contrast enhanced Hα image from Kanzelhöhe Solar Observatory, (b) contrast enhanced AIA λ171 Å image, (c) contrast enhanced AIA λ304 Å image, and (d) two-hour average of 160 magnetograms clipped between ± 25 G. The contour of the Hα filament in panel a is plotted in panels b, c, and d. The white boxes labeled A and B mark the regions that we use later to determine the horizontal proper motions (region A, see Figs. 5 and 6) and the counter-streaming flows (region B, see Fig. 8)
Current usage metrics show cumulative count of Article Views (full-text article views including HTML views, PDF and ePub downloads, according to the available data) and Abstracts Views on Vision4Press platform.
Data correspond to usage on the plateform after 2015. The current usage metrics is available 48-96 hours after online publication and is updated daily on week days.
Initial download of the metrics may take a while.