Fig. 3
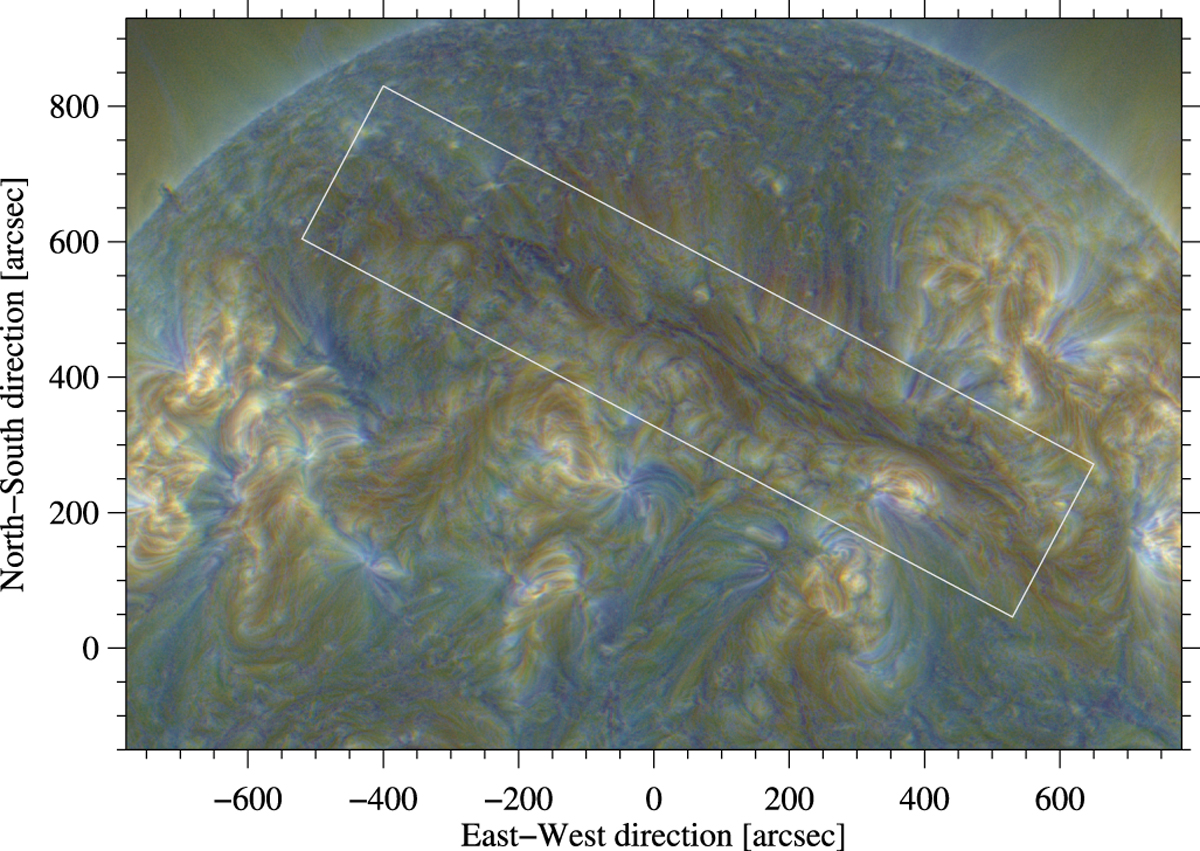
False-color image of the giant solar filament at 12:00 UT on November 16. The image is composed of three images obtained in the wavelength bands λ171 Å, λ193 Å, and λ211 Å. In the composed image different parts of the corona are highlighted. The blue parts show lower temperatures in the corona, while the yellow parts show the hotter regions. The filament appears as a dark structure enclosed by the white box crossing the Sun’s central meridian in the northern hemisphere.
Current usage metrics show cumulative count of Article Views (full-text article views including HTML views, PDF and ePub downloads, according to the available data) and Abstracts Views on Vision4Press platform.
Data correspond to usage on the plateform after 2015. The current usage metrics is available 48-96 hours after online publication and is updated daily on week days.
Initial download of the metrics may take a while.