Fig. 2
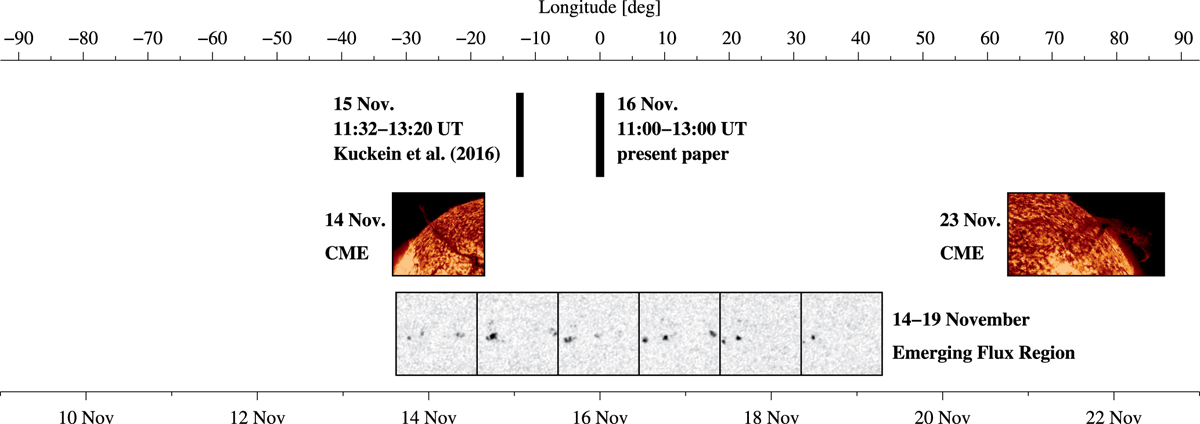
Timeline showing selected events related to the filament that occurred during the filament’s passage across the solar disk, also indicated in the lower axis showing the time of observations. The indicated dates refer to 12:00 UT. The longitudinal position of the middle of the filament is shown at the upper axis. The present observations were taken when the filament was centered on the central meridian. The timeline for the CMEs are shown from activation toeruption. The EFR, located to the right of the filament, is shown at different evolutionary stages.
Current usage metrics show cumulative count of Article Views (full-text article views including HTML views, PDF and ePub downloads, according to the available data) and Abstracts Views on Vision4Press platform.
Data correspond to usage on the plateform after 2015. The current usage metrics is available 48-96 hours after online publication and is updated daily on week days.
Initial download of the metrics may take a while.