Fig. 1
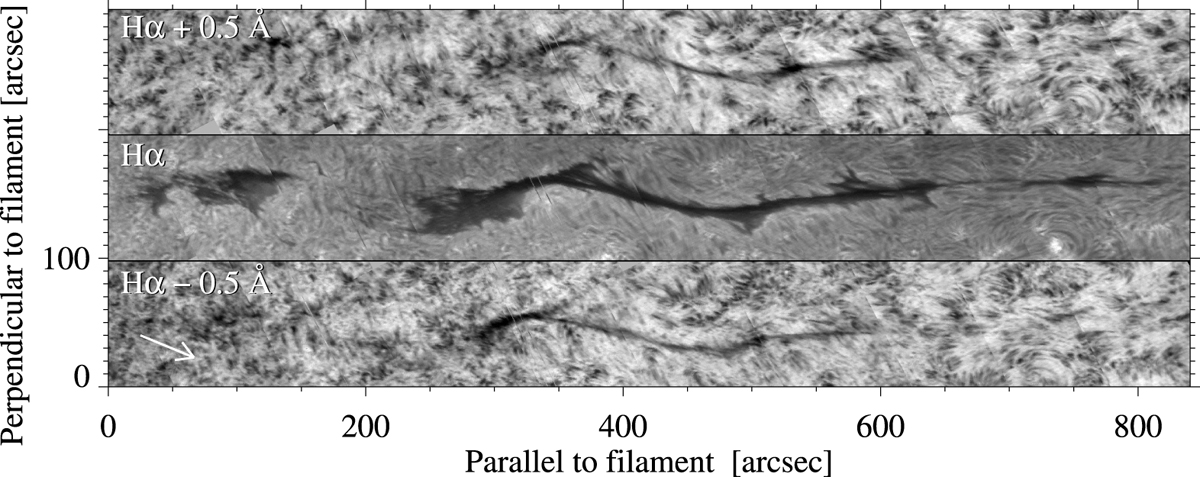
Slit-reconstructed image of the VTT observations with the Echelle spectrograph at different wavelength positions along the Hα line. The giant filament extends over about 800′′ , displays a gap at the left hand side and an EFR appears as a bright area below the thin spine of the filament on the right-hand side. The observations were carried out on 2011 November 15 between 11:38 UT and 13:20 UT. From top to bottom: Hα + 0.5 Å, Hα line core, and Hα − 0.5 Å. The white arrow points to disk center.
Current usage metrics show cumulative count of Article Views (full-text article views including HTML views, PDF and ePub downloads, according to the available data) and Abstracts Views on Vision4Press platform.
Data correspond to usage on the plateform after 2015. The current usage metrics is available 48-96 hours after online publication and is updated daily on week days.
Initial download of the metrics may take a while.