Fig. 3
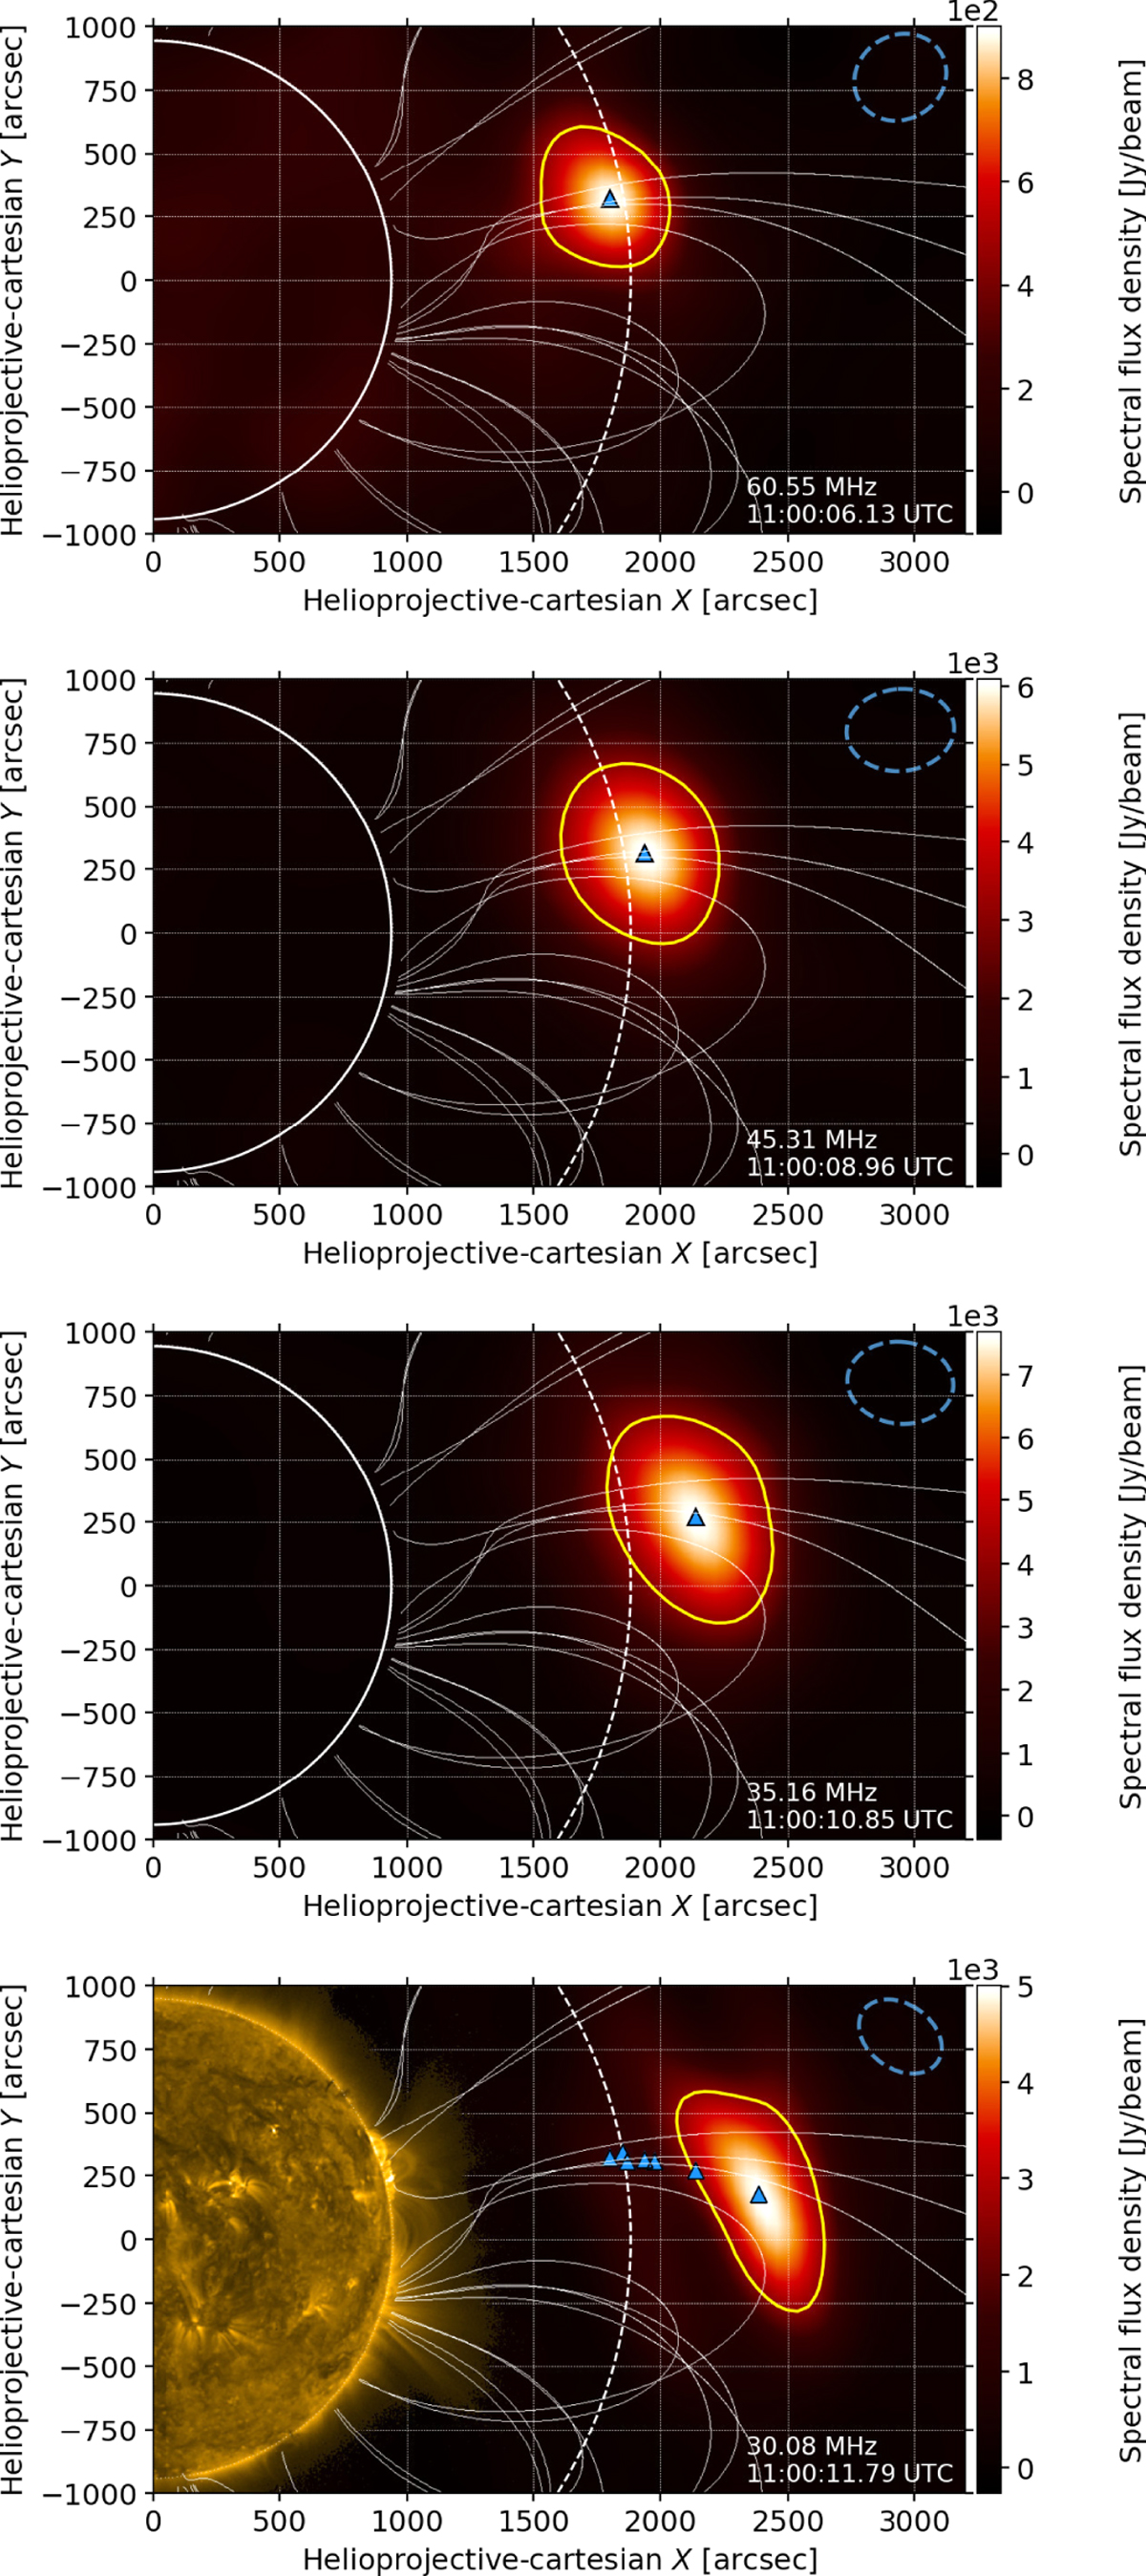
LOFAR images at four frequencies of the first type-III burst starting at 11:00:05 UTC (Fig. 2). The yellow line shows the size of the radio source at a contour level of 50% of its peak flux density. Its high flux density makes the thermal emission from the Sun invisible on this color scale. The markers show the burst’s centroid position (Table 1) at each frequency. They reveal the burst’s propagation path when shown all together as in the last image at 30 MHz. It also shows an extreme ultraviolet (174 Å) image of the Sun from the PROBA2 satellite. The coronal magnetic field is shown by the white lines. The white solid and dashed circles indicate the distances of 1 and 2 R⊙, respectively. The blue, dashed ellipse (top right) represents the FWHM of the Gaussian fit of the PSF.
Current usage metrics show cumulative count of Article Views (full-text article views including HTML views, PDF and ePub downloads, according to the available data) and Abstracts Views on Vision4Press platform.
Data correspond to usage on the plateform after 2015. The current usage metrics is available 48-96 hours after online publication and is updated daily on week days.
Initial download of the metrics may take a while.