Fig. 9
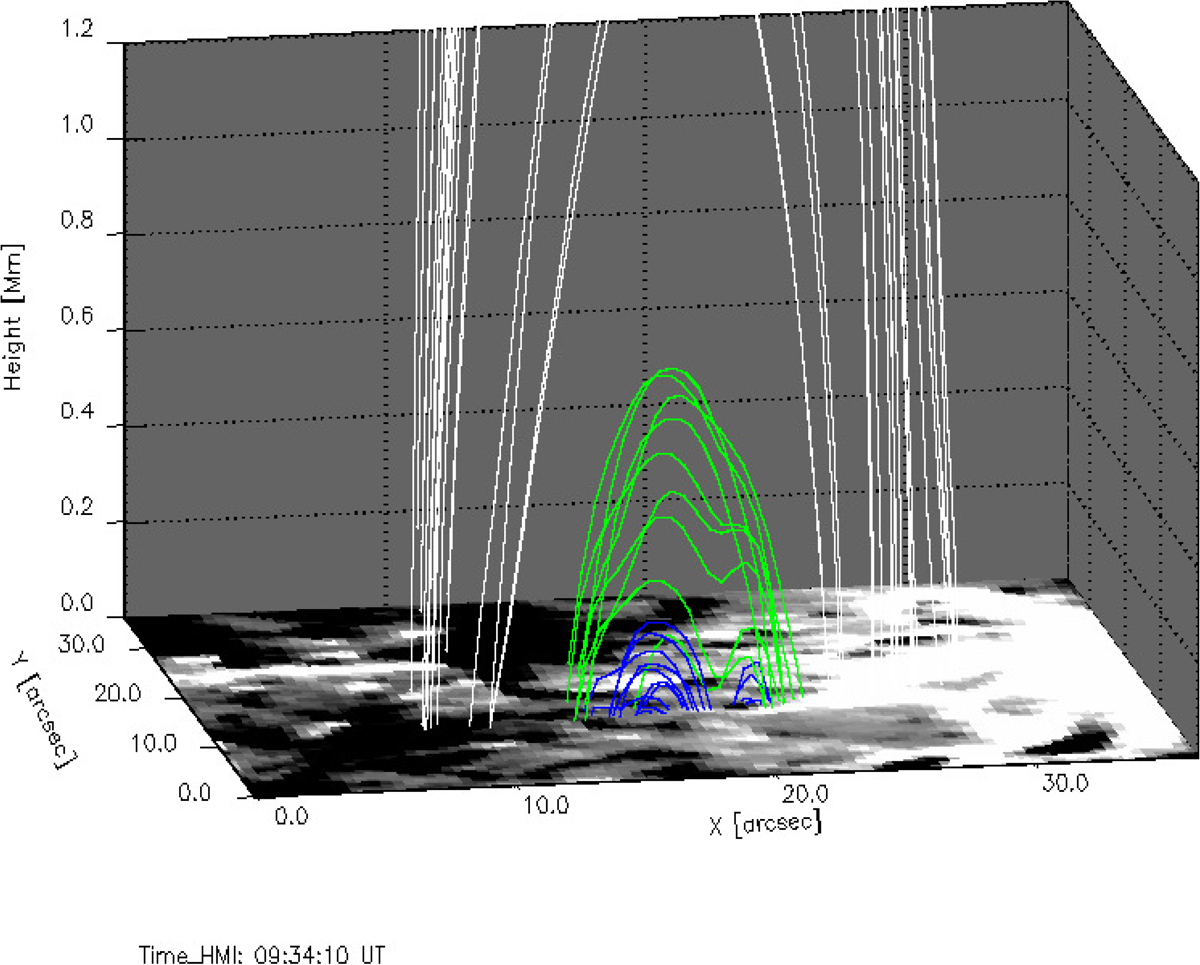
Extrapolated 3D magnetic field lines overplotted on the photosheric magnetogram. Blue lines show the small-scale magnetic flux tubes connected to the small bipole region indicated with the blue rectangle in Fig. 8. Green lines indicate the magnetic field lines that show a dip near their middle part. White lines indicate the overlying large-scale loop. White lines are closed lines, only part of the lines is shown here in order to highlight the small-scale flux tubes. See Sect. 5.2.
Current usage metrics show cumulative count of Article Views (full-text article views including HTML views, PDF and ePub downloads, according to the available data) and Abstracts Views on Vision4Press platform.
Data correspond to usage on the plateform after 2015. The current usage metrics is available 48-96 hours after online publication and is updated daily on week days.
Initial download of the metrics may take a while.