Fig. 8
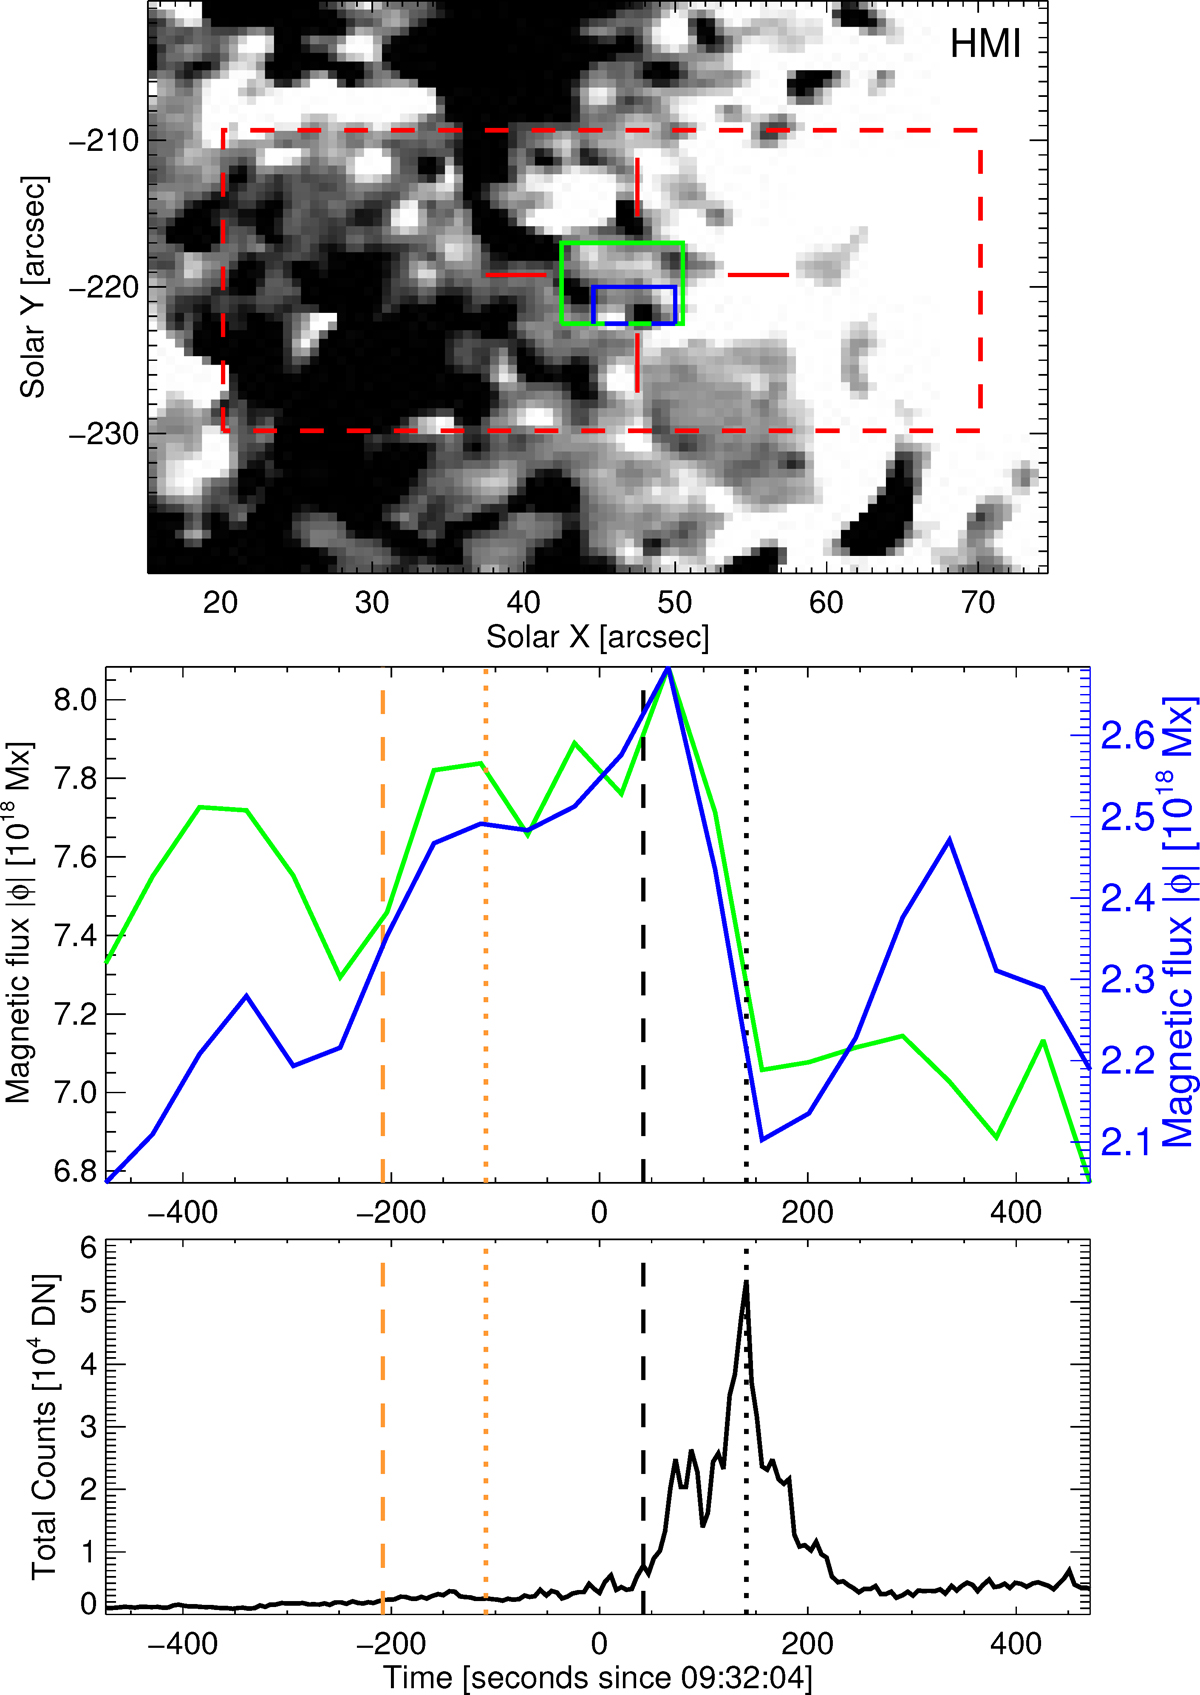
Evolution of the magnetic flux below the loop apex and the total intensity of Si IV 1394 Å. Top panel: the magnetogram obtained by the HMI at 09:34:40 UT. The red dashed rectangle shows the field of view of Fig. 2. The red horizontal and vertical lines that form a cross indicate the location of the loop apex at the slit position. The green and blue rectangles indicate the region from which the total magnetic flux is obtained. Middle panel: the evolution of the total magnetic flux in the regions shown by green and blue rectangles in the top panel. Bottom panel: the evolution of the total intensity in Si IV 1394 Å. The black dashed and dotted lines show the onset of the brightening and the maximum brightening, respectively. The brown dashed and dotted lines show the corresponding time of the onset and maximum brightening subtracted by the Alfvén crossing time. See Sect. 5.2.
Current usage metrics show cumulative count of Article Views (full-text article views including HTML views, PDF and ePub downloads, according to the available data) and Abstracts Views on Vision4Press platform.
Data correspond to usage on the plateform after 2015. The current usage metrics is available 48-96 hours after online publication and is updated daily on week days.
Initial download of the metrics may take a while.