Fig. 7
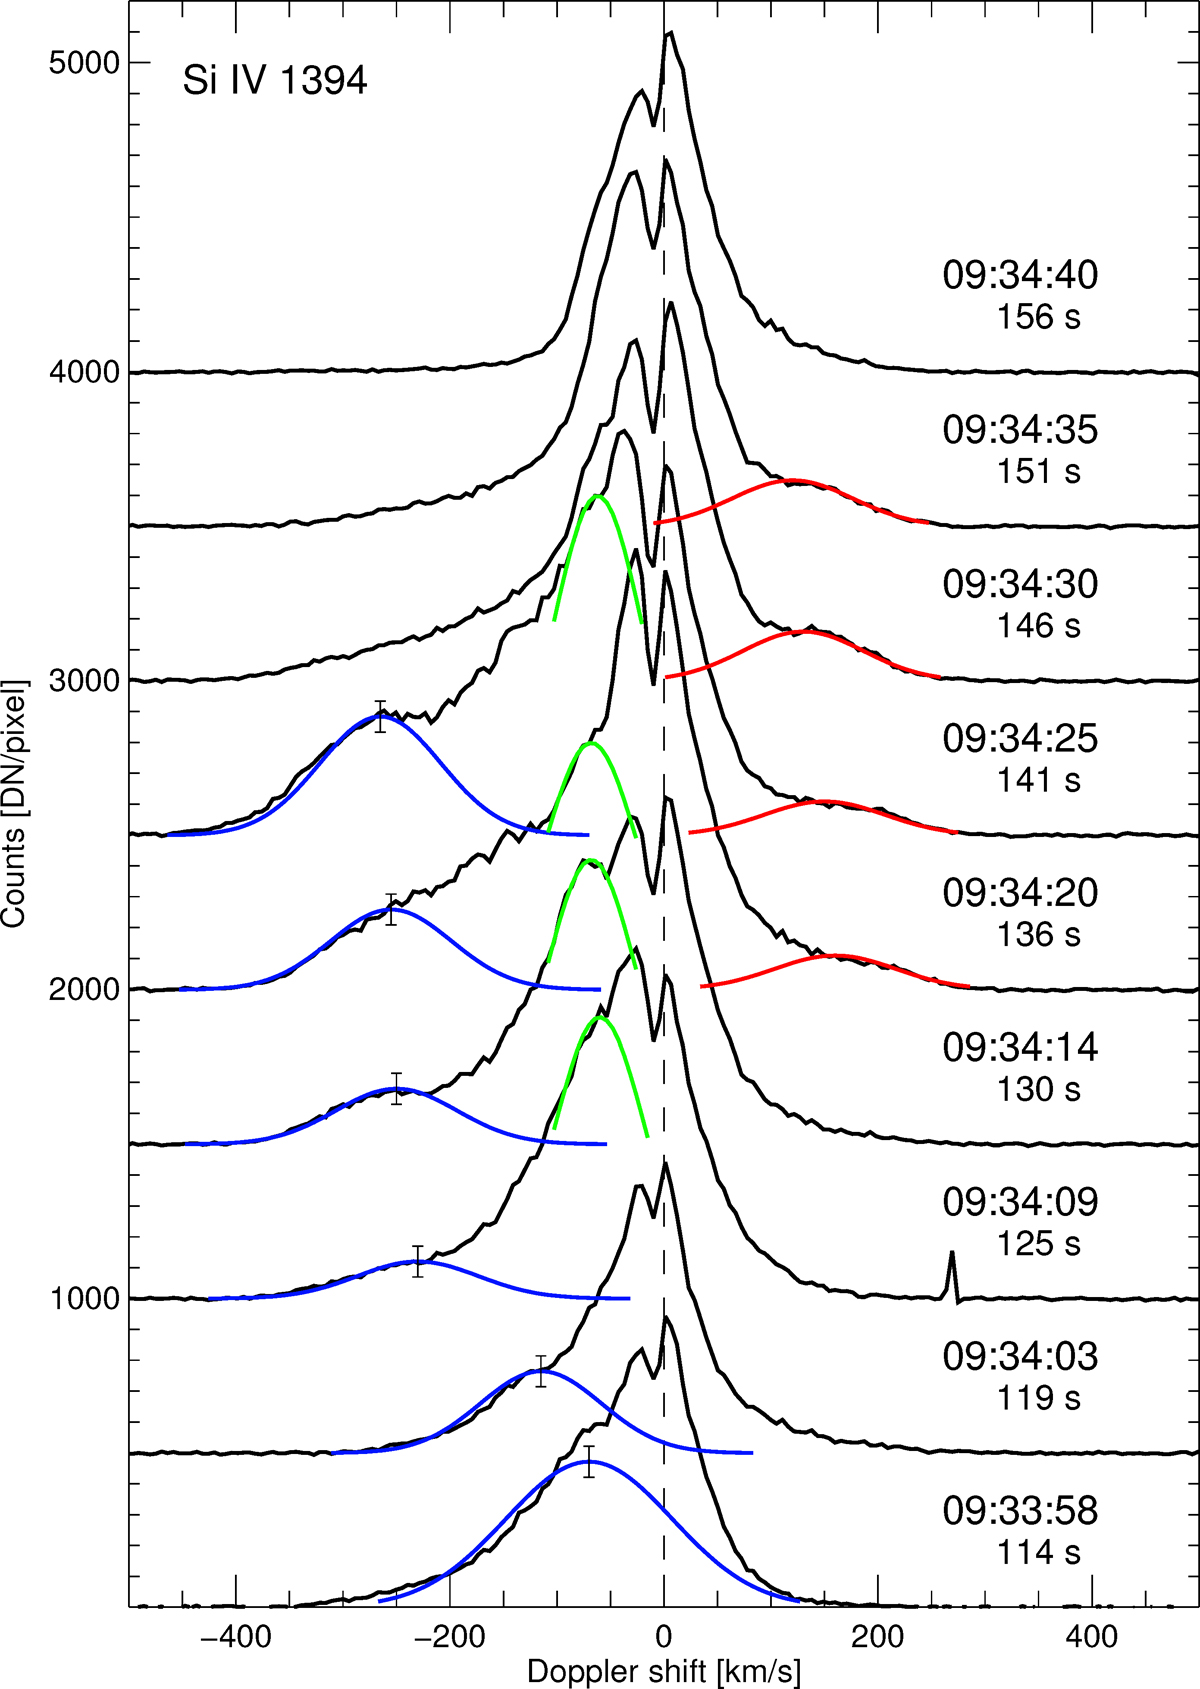
Line profiles of Si IV 1394 Å during phase 2 of the brightening. These are stacked profiles, i.e., each time step is plotted with an intensity increased by 500 counts. These profiles are taken in the middle of the loop crossing the slit (see arrow in bottom left panel of Fig. 2). The colored Gaussian profiles indicate by-eye fits to the obvious spectral features in the line wings. Each set of the blue, green, and red profiles has the same width. The blue profiles are shifted by −70 km s−1 , −115 km s−1, −230 km s−1 , −250 km s−1 , −255 km s−1 , and −265 km s−1 , from bottom to top. The center of each blue Gaussian is marked by a black bar. The green profiles show the possible blueshifted components with lower speed, while the red profiles highlight a redshifted component. See Sect. 5.1.
Current usage metrics show cumulative count of Article Views (full-text article views including HTML views, PDF and ePub downloads, according to the available data) and Abstracts Views on Vision4Press platform.
Data correspond to usage on the plateform after 2015. The current usage metrics is available 48-96 hours after online publication and is updated daily on week days.
Initial download of the metrics may take a while.