Fig. 6
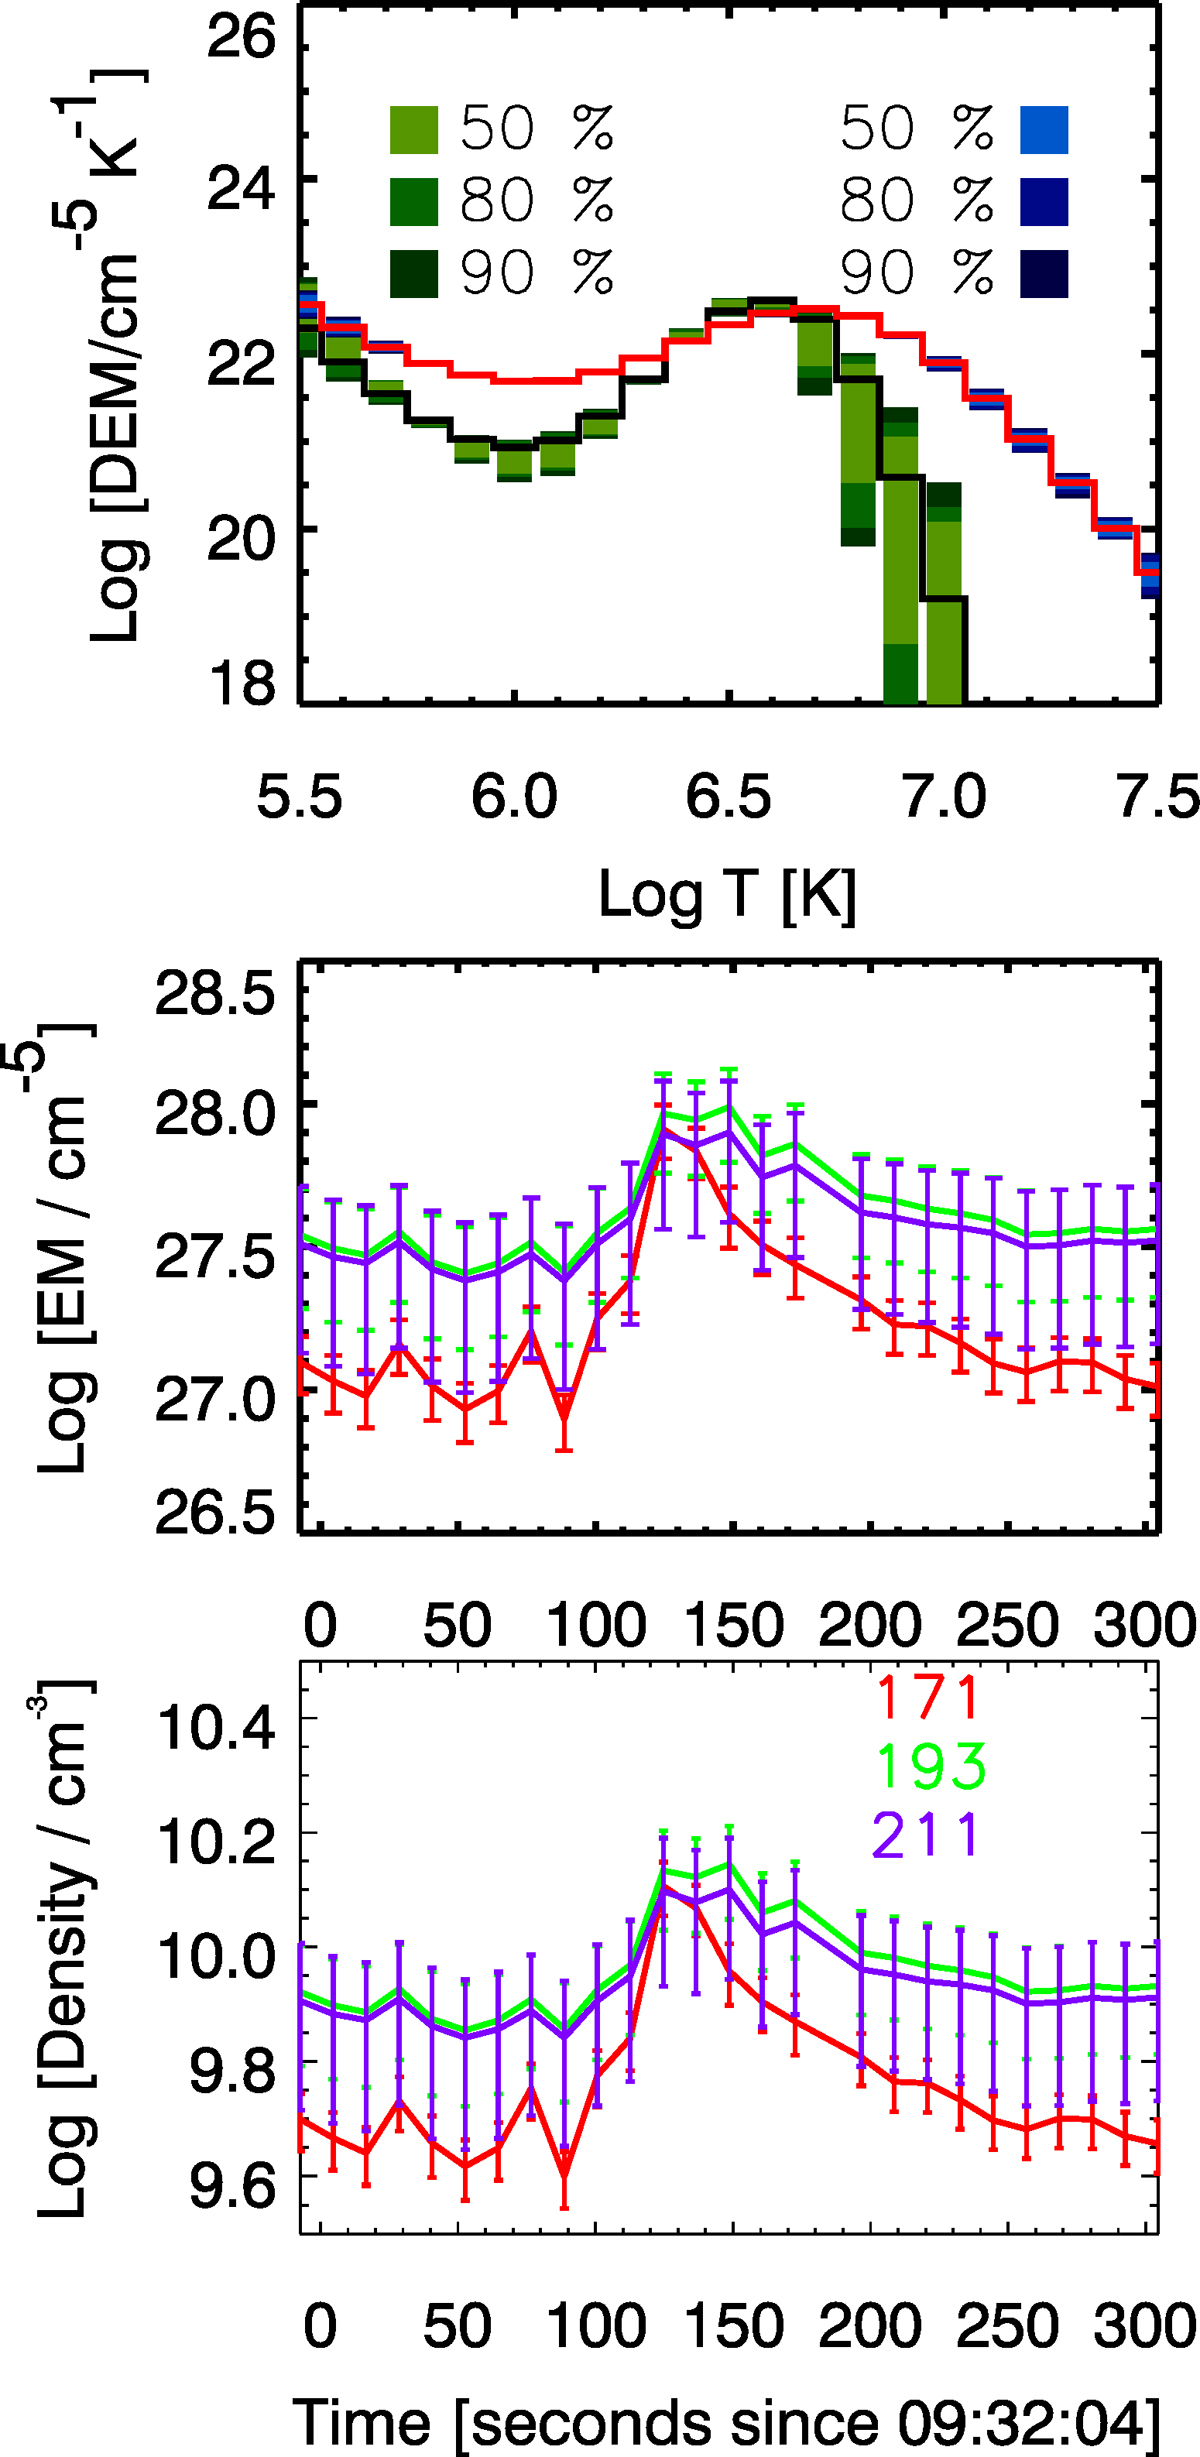
Upper panel: the estimated DEM from six AIA EUV channels (171 Å, 193 Å, 211 Å, 131 Å, 335 Å, and 94 Å)
around 09:33:37 UT (at 93 s, black profile with green error bars) and 09:34:25 UT (at 141 s, red profile with blue error
bars) at theregion indicated with the red rectangles in Fig. 2. The colors from light to dark correspond
to the confidence interval with a confidence level of 50%, 80%, and 90%, respectively. Middle panel: the emission
measure of the 171 Å, 193 Å, and 211 Å channels obtained by integrating the DEM profile over the temperature range of
105.7 − 106.1 K,
106.05 − 106.3 K,
and 106.15−106.35 K,
respectively. The error bars are estimated from the confidence interval with a confidence level of
90%.
Lower panel:the electron density estimated by ![]() ,
where d z
is assumed to be a constant of 500 km. See Sect. 4.
,
where d z
is assumed to be a constant of 500 km. See Sect. 4.
Current usage metrics show cumulative count of Article Views (full-text article views including HTML views, PDF and ePub downloads, according to the available data) and Abstracts Views on Vision4Press platform.
Data correspond to usage on the plateform after 2015. The current usage metrics is available 48-96 hours after online publication and is updated daily on week days.
Initial download of the metrics may take a while.