Fig. 4
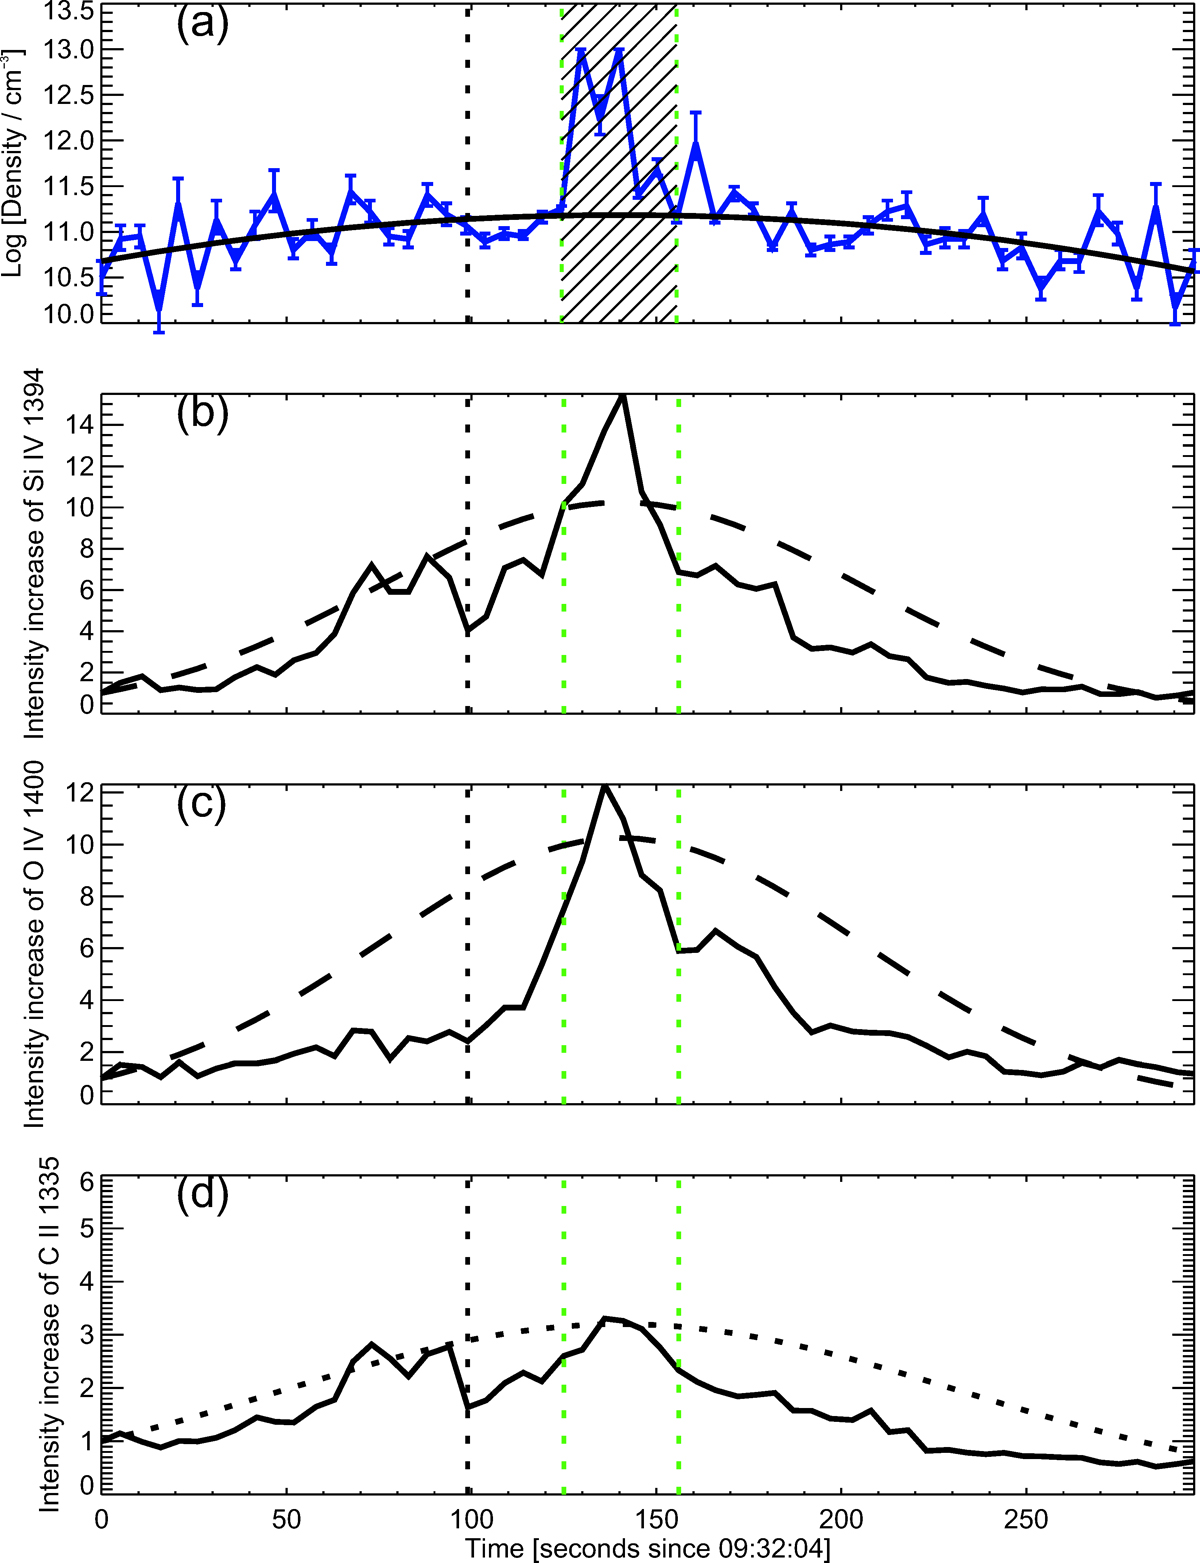
Temporal evolution of the electron density and the line intensity. Panel a: the electron density in the source
region of OIV in the transition region derived from the ratio of the intercombination O IV lines at 1401 and
1400 Å including an error estimate. The black solid curve shows the fit to the density variation. For this fit the
time range indicated by the shaded area was ignored because these data points are flawed by the strong blending
of O IV 1401 Å by the excess emission in the far blue wing of Si IV 1403 Å. Panels b to d: the normalized intensity
![]() of Si IV 1394 Å, O IV 1401 Å, and C II 1335 Å (black solid curves). The black dashed curves in panels b and
c
show the normalized density squared
of Si IV 1394 Å, O IV 1401 Å, and C II 1335 Å (black solid curves). The black dashed curves in panels b and
c
show the normalized density squared ![]() ,
while the black dotted curve in panel d shows the normalized density
,
while the black dotted curve in panel d shows the normalized density ![]() .
The black dotted vertical lines indicate the boundary that separates the loop brightening into two phases. The green
dotted vertical lines demarcate the time span when the density estimation is not reliable. Just as in Fig. 3, all values are taken at the position in the middle of the loop where it crosses the slit. See Sect. 4.
.
The black dotted vertical lines indicate the boundary that separates the loop brightening into two phases. The green
dotted vertical lines demarcate the time span when the density estimation is not reliable. Just as in Fig. 3, all values are taken at the position in the middle of the loop where it crosses the slit. See Sect. 4.
Current usage metrics show cumulative count of Article Views (full-text article views including HTML views, PDF and ePub downloads, according to the available data) and Abstracts Views on Vision4Press platform.
Data correspond to usage on the plateform after 2015. The current usage metrics is available 48-96 hours after online publication and is updated daily on week days.
Initial download of the metrics may take a while.