Fig. 3
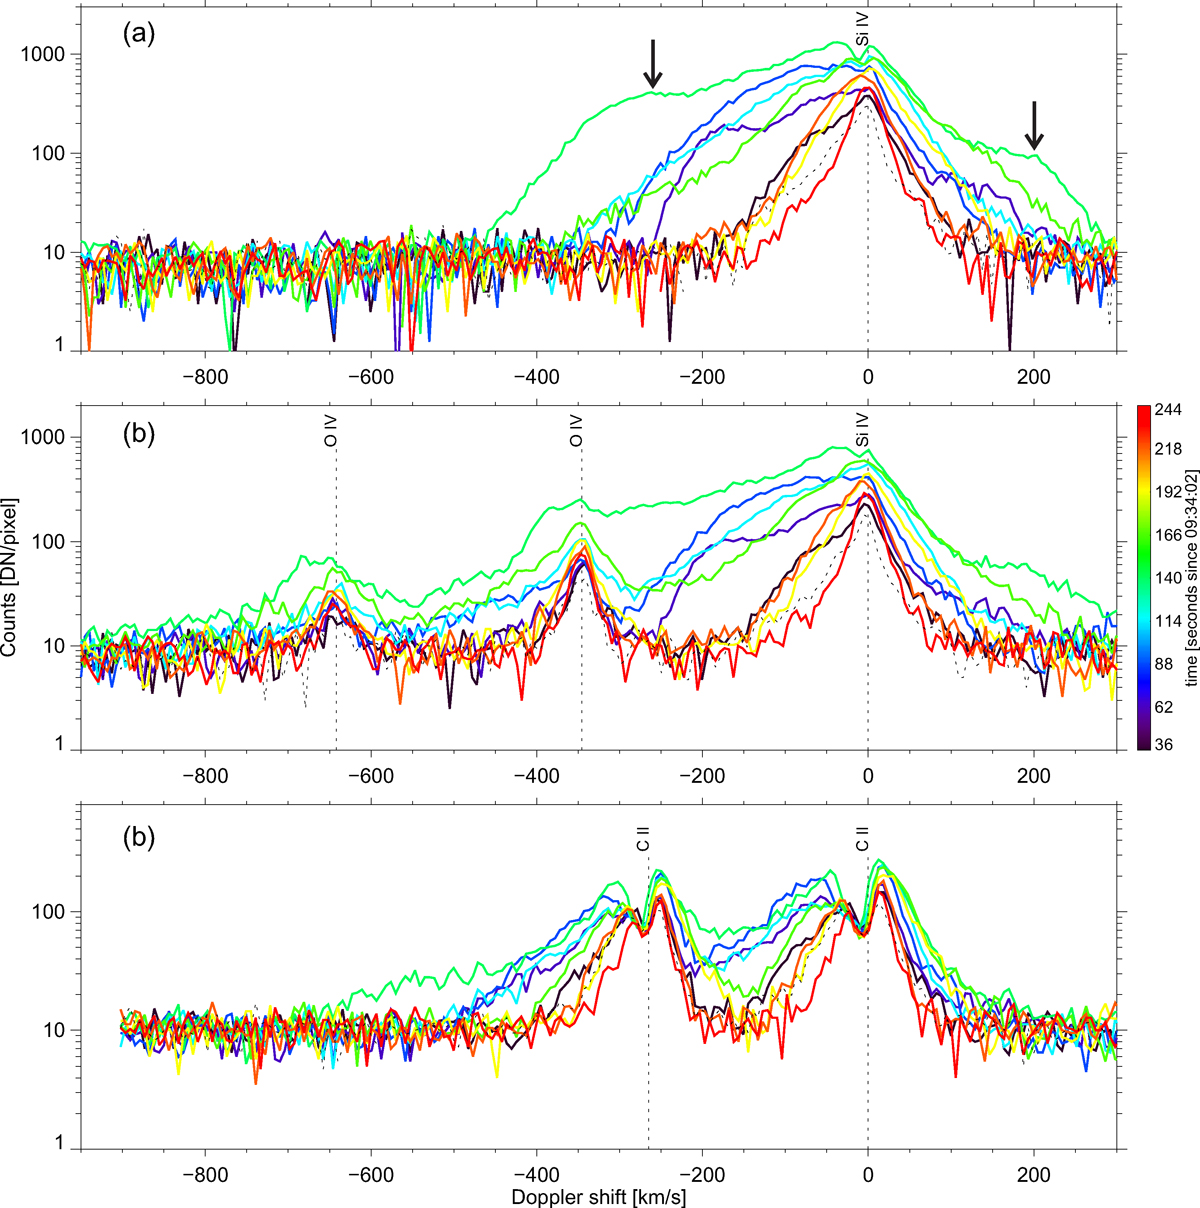
Temporal evolution of the line profiles of Si IV, O IV, and C II. The three rows show spectral windows centered around Si IV 1394 Å (top), Si IV 1403 Å, including the nearby inter-combination lines of O IV (middle), and C II 1335 Å and 1336 Å (bottom). The wavelengths are given in Doppler-shift units relative to the rest wavelengths of Si IV 1394 Å, Si IV 1403 Å, andC II 1336 Å. Each panel shows the time evolution of the line profiles over 3.5 min starting at 09:32:40 UT. Different line colors represent different times, as indicated by the color bar showing the time in seconds since 09:32:04 UT. All spectra are taken at the location along the slit in the middle of the loop crossing the slit (see the arrow in the lower left panel of Fig. 2). See Sect. 3.
Current usage metrics show cumulative count of Article Views (full-text article views including HTML views, PDF and ePub downloads, according to the available data) and Abstracts Views on Vision4Press platform.
Data correspond to usage on the plateform after 2015. The current usage metrics is available 48-96 hours after online publication and is updated daily on week days.
Initial download of the metrics may take a while.