Fig. 2
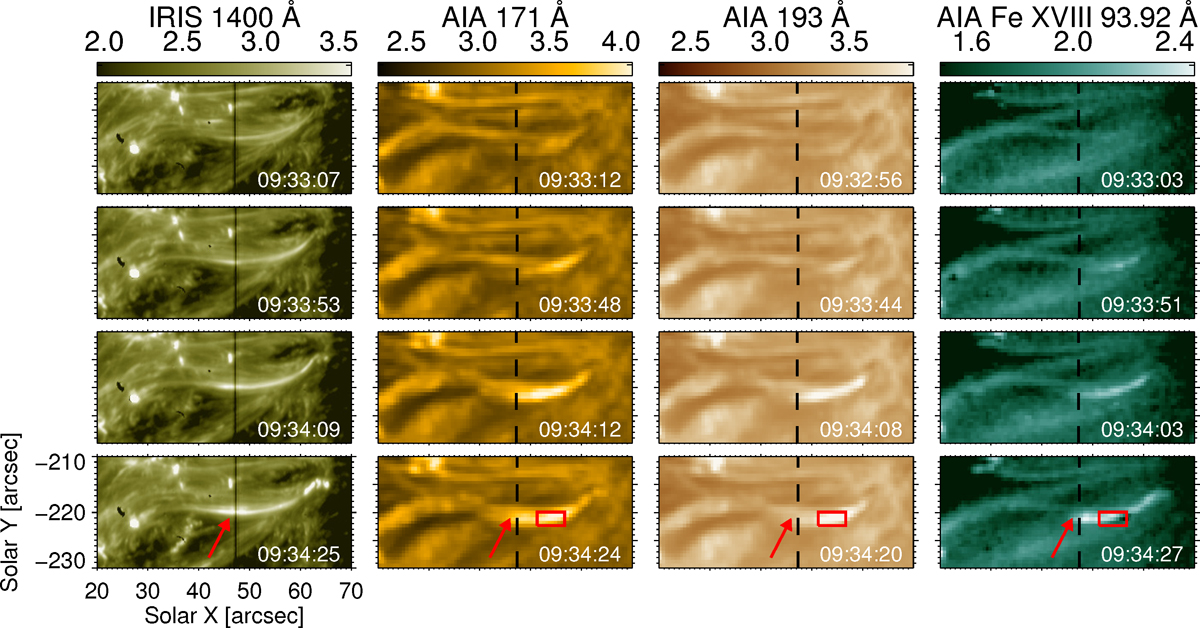
Temporal evolution of the loop. The four rows show snapshots at the indicated times. The columns show the images obtained through the IRIS slit-jaw-images in 1400 Å, the AIA channels at 171 Å and 193 Å, and the Fe xviii (93.92 Å) emission extracted from the AIA channel at 94 Å. The images show plasma at increasing temperatures at below 0.1 MK, 1 MK, 1.5 MK, and at around 7 MK. The black dashed vertical lines indicate the slit position of the IRIS spectrometer. Red arrows point at the loop studied here. Red rectangles show the region of the differential emission measure (DEM) analysis, the result of which is shown in Fig. 7. The color tables shows the data number per pixel on a log 10 scale. The same color table is used for each wavelength channel at the different time steps. The field of view is indicated in Fig. 1 by the solid rectangle. See Sect. 3. A corresponding animation, Animation 1, is available in the online journal.
Current usage metrics show cumulative count of Article Views (full-text article views including HTML views, PDF and ePub downloads, according to the available data) and Abstracts Views on Vision4Press platform.
Data correspond to usage on the plateform after 2015. The current usage metrics is available 48-96 hours after online publication and is updated daily on week days.
Initial download of the metrics may take a while.