Fig. B.2
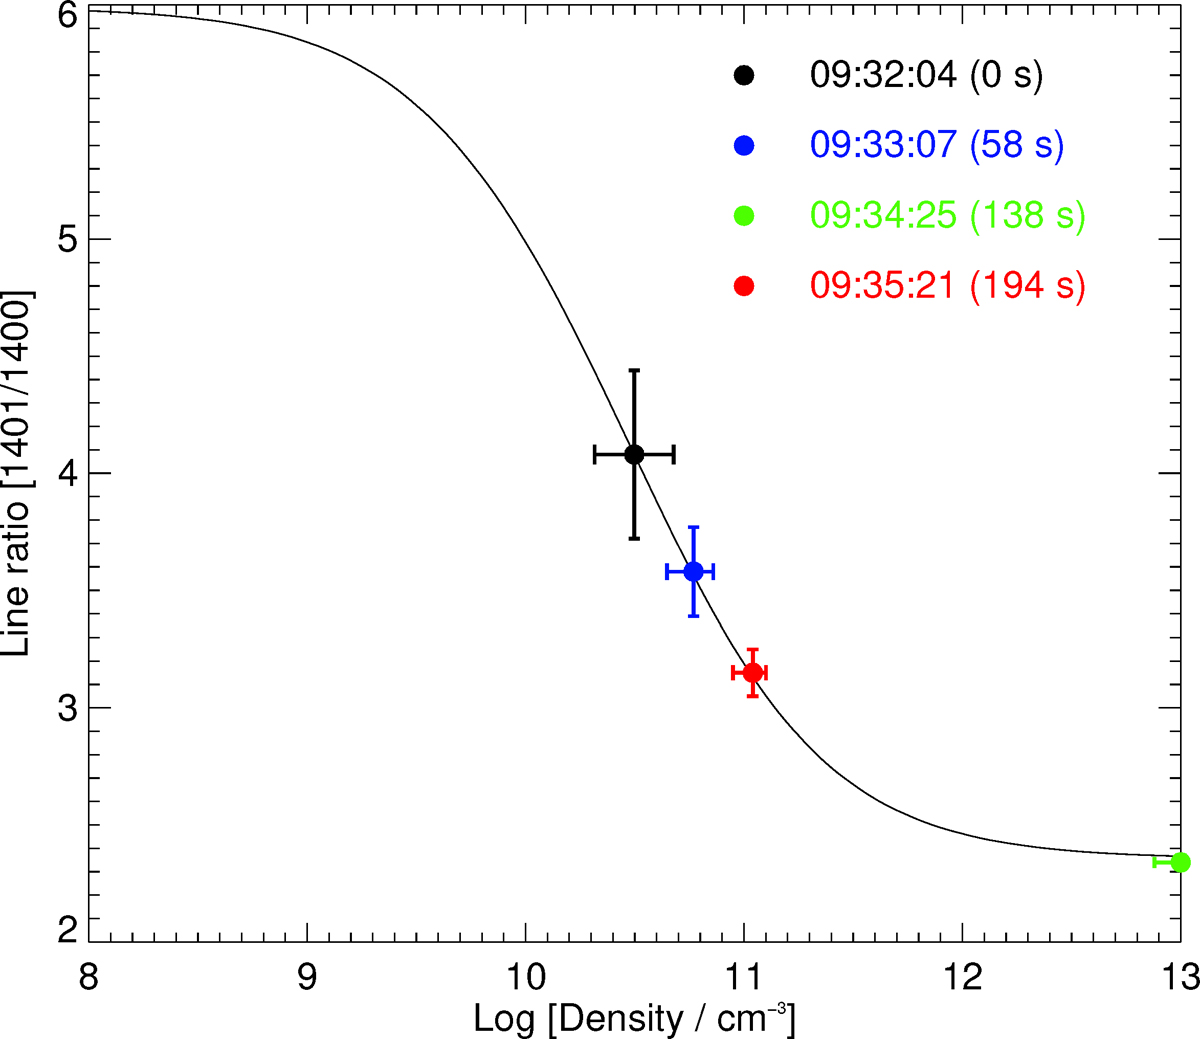
Example for the estimation of the electron density at the source region of O IV. The black solid curve shows the theoretical relation between the electron density and the line ratio of O IV 1401 Å and O IV 1400 Å obtained from the Chianti database. The colored dots show the line ratio and density for the four sample spectra in Fig. B.1. The horizontal and vertical bars show the uncertainty of the estimated electron density.
Current usage metrics show cumulative count of Article Views (full-text article views including HTML views, PDF and ePub downloads, according to the available data) and Abstracts Views on Vision4Press platform.
Data correspond to usage on the plateform after 2015. The current usage metrics is available 48-96 hours after online publication and is updated daily on week days.
Initial download of the metrics may take a while.