Fig. B.1
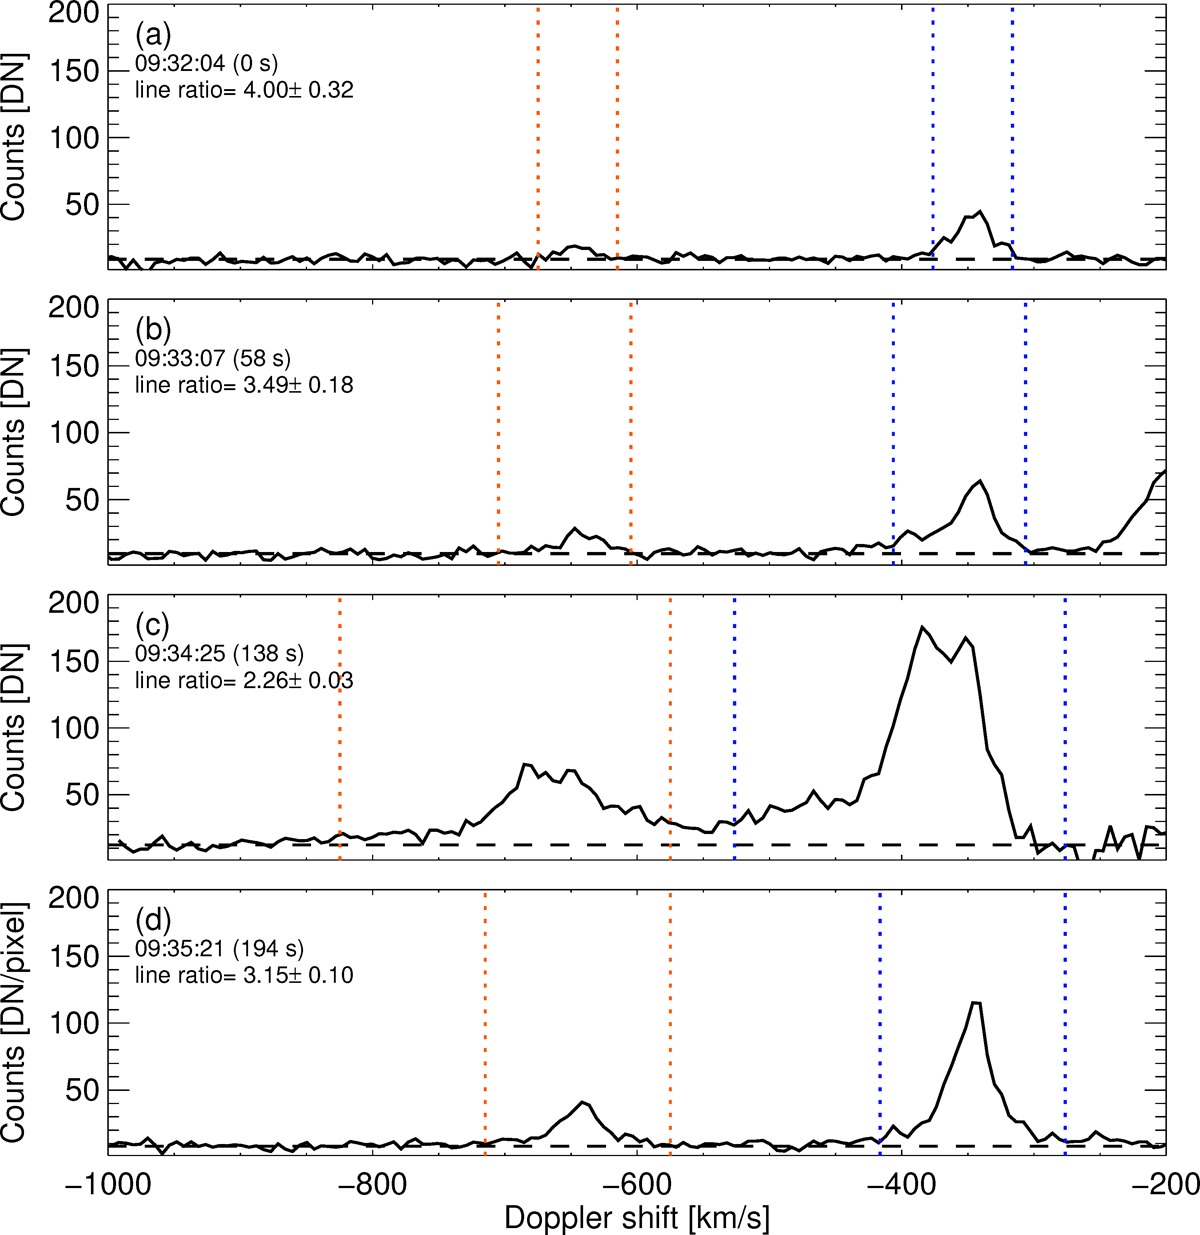
Spectral range around the intercombination O IV lines to estimate the electron density. The Si IV line is not part of this range and would peak around a Doppler shift of 0 km s−1 . The orange and blue lines show the Doppler-shift range we used to estimate the total intensity of O IV 1400 Å and the total intensity of O IV 1401 Å, respectively. The black dashed horizontal lines show the continuum level.
Current usage metrics show cumulative count of Article Views (full-text article views including HTML views, PDF and ePub downloads, according to the available data) and Abstracts Views on Vision4Press platform.
Data correspond to usage on the plateform after 2015. The current usage metrics is available 48-96 hours after online publication and is updated daily on week days.
Initial download of the metrics may take a while.