Fig. 10
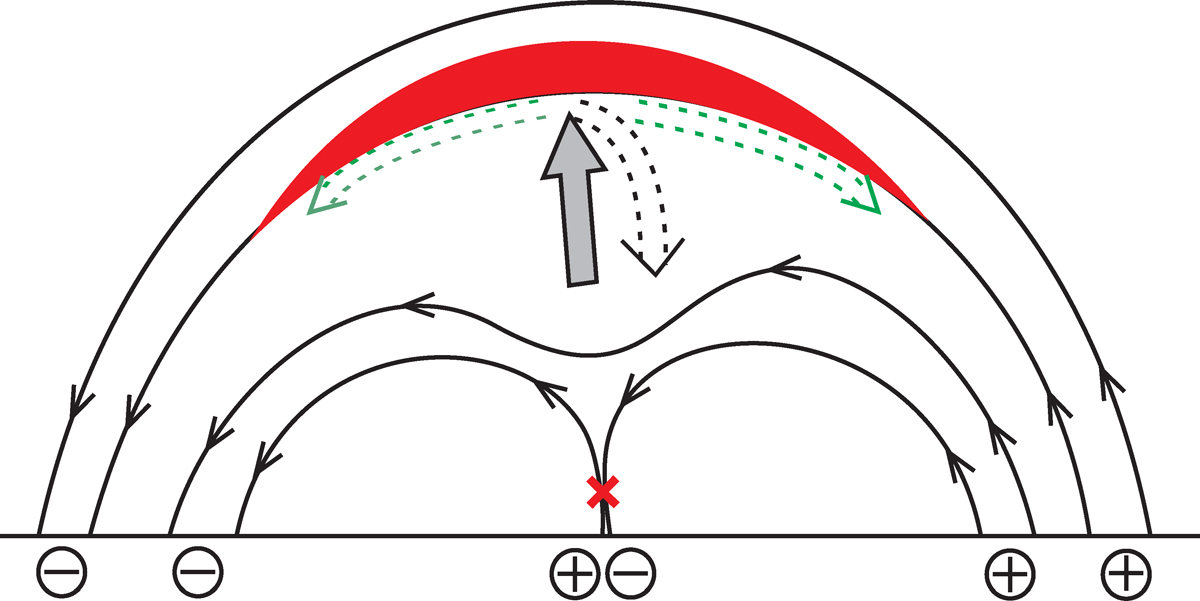
Scenario for the event. The black lines indicate magnetic field lines, the plus and minus within an empty circle denote opposite magnetic polarities. The red cross shows a possible reconnection site between the small-scale magnetic flux tubes. The arrows indicate the flow patterns, and the red region represents the hot plasma that is heated near the loop apex by the interaction of the upflow with the above-lying magnetic loop. The gray solid arrow and the black dashed arrow stand for the upflow and possible rebound flow. The green arrows show the possible two lateral flows that have not been observed in this case, probably owing to the sit-and-stare mode of the spectral observation. See Sect. 6.
Current usage metrics show cumulative count of Article Views (full-text article views including HTML views, PDF and ePub downloads, according to the available data) and Abstracts Views on Vision4Press platform.
Data correspond to usage on the plateform after 2015. The current usage metrics is available 48-96 hours after online publication and is updated daily on week days.
Initial download of the metrics may take a while.