Fig. 3
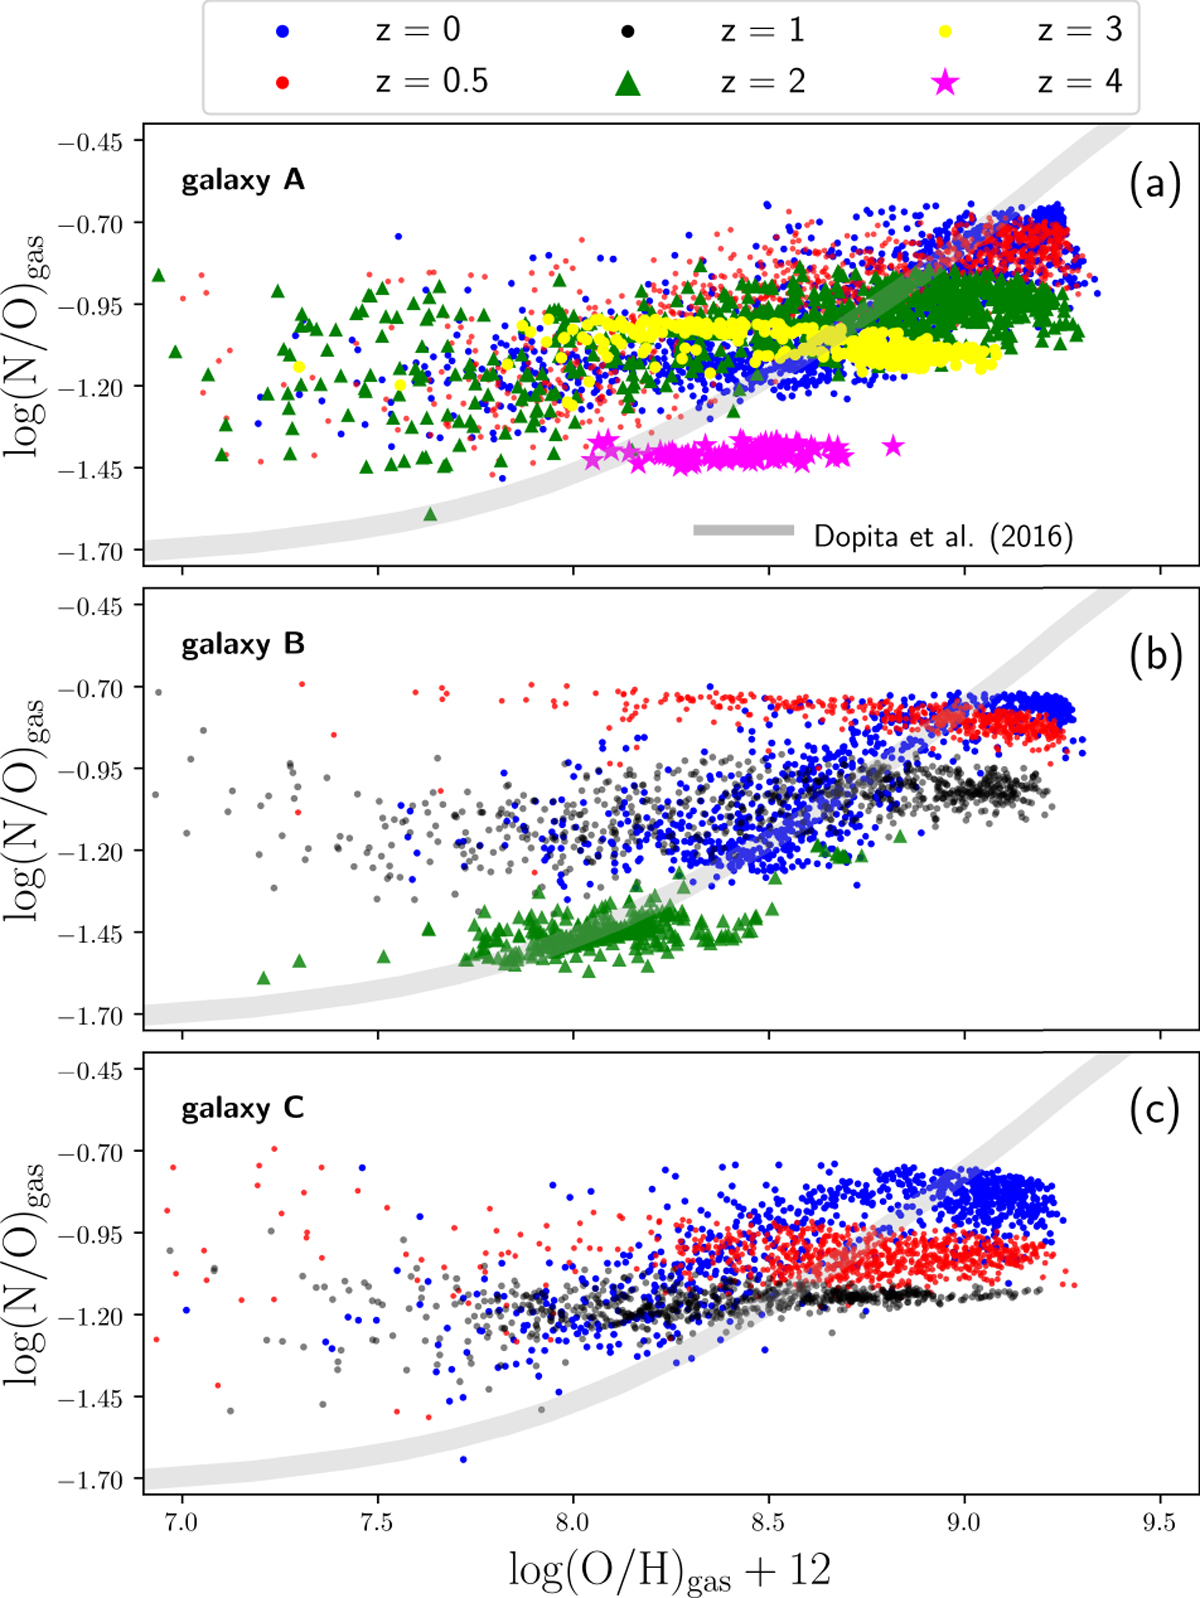
The redshift evolution of the predicted gas-phase log(N/O) vs. log(O/H) + 12 abundance patterns within our three reference galaxies. Galaxies A, B, and C clearly show different chemical evolution of the ISM abundances with redshift. We compare our simulation with the observed average N/O–O/H relation from Dopita et al. (2016, solid grey line).
Current usage metrics show cumulative count of Article Views (full-text article views including HTML views, PDF and ePub downloads, according to the available data) and Abstracts Views on Vision4Press platform.
Data correspond to usage on the plateform after 2015. The current usage metrics is available 48-96 hours after online publication and is updated daily on week days.
Initial download of the metrics may take a while.