Fig. 2
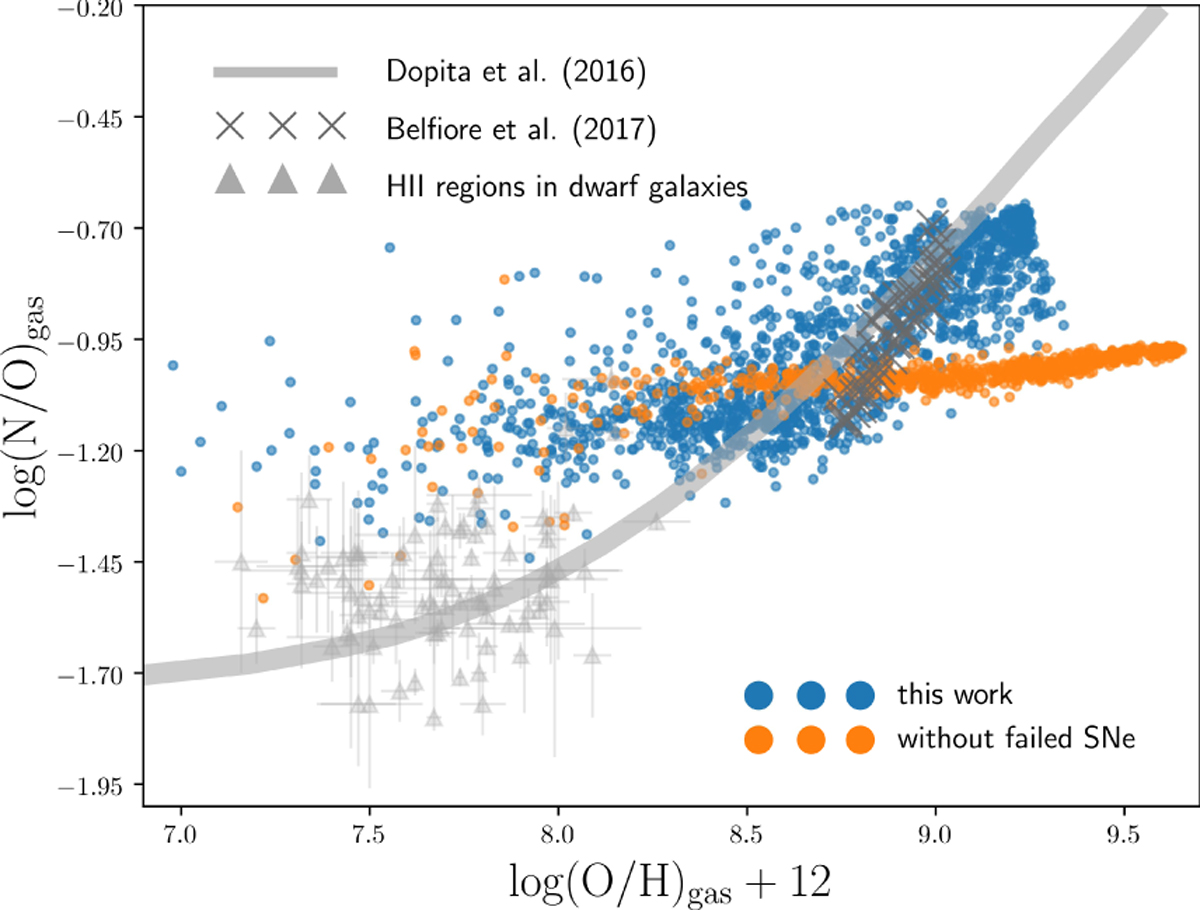
Predicted gas-phase log(N/O) vs. log(O/H) + 12 abundance pattern in Galaxy A with failed SNe (light blue points; this work) and without failed SNe (orange points). The solid grey line corresponds to the average relation obtained from various observations by Dopita et al. (2016, see references therein), the grey points with error bars toa compilation of data of individual HII regions in blue diffuse dwarf galaxies (Berg et al. 2012; Izotov et al. 2012; James et al. 2015), and the dark grey crosses to Belfiore et al. (2017) from a sample of spatially resolved galaxies from the MaNGa survey.
Current usage metrics show cumulative count of Article Views (full-text article views including HTML views, PDF and ePub downloads, according to the available data) and Abstracts Views on Vision4Press platform.
Data correspond to usage on the plateform after 2015. The current usage metrics is available 48-96 hours after online publication and is updated daily on week days.
Initial download of the metrics may take a while.