Open Access
Fig. 1
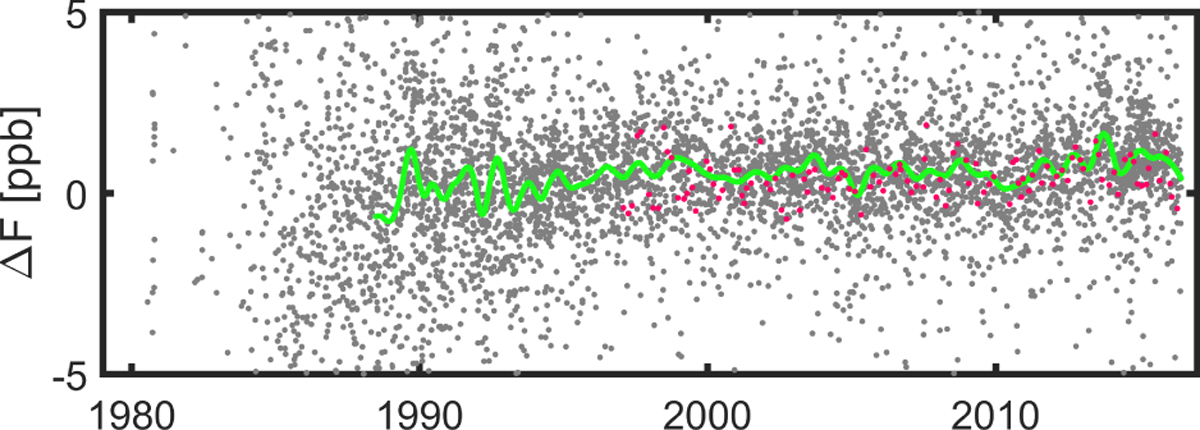
Session-wise corrections to the scale factor Δ F w.r.t. ITRF2014. The green line follows the smoothed estimates using the local least-squares regression. The magenta dots highlight the estimates from RDV sessions.
Current usage metrics show cumulative count of Article Views (full-text article views including HTML views, PDF and ePub downloads, according to the available data) and Abstracts Views on Vision4Press platform.
Data correspond to usage on the plateform after 2015. The current usage metrics is available 48-96 hours after online publication and is updated daily on week days.
Initial download of the metrics may take a while.