Fig. 6
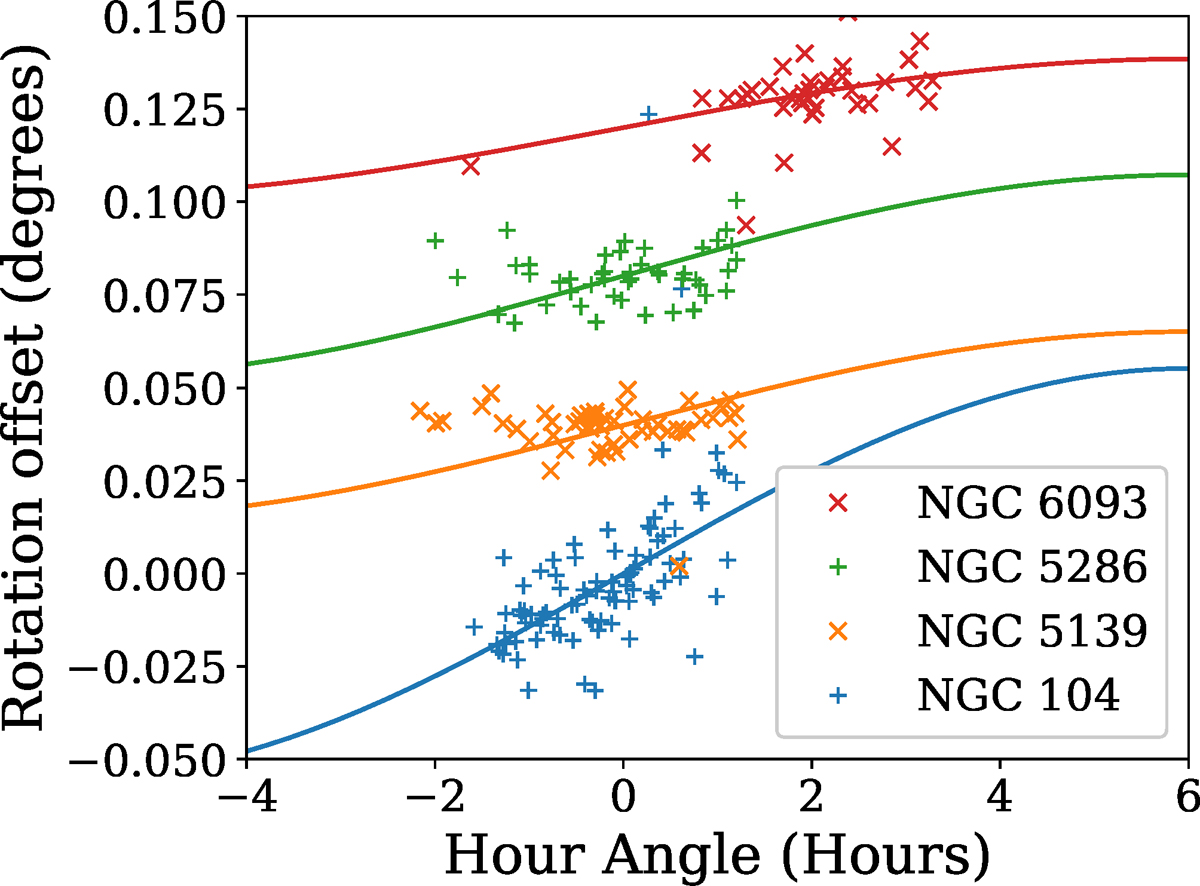
Variation of the derived detector orientation with the hour angle at time of observation. Coloured points show individual measurements for four globular clusters, with clusters being offset by 0.04° for clarity. The solid sinusoidal lines show the predicted variation due to a polar axis offset of 0.017°. The change in detector orientation due to this effect increases towards the poles, with NGC 104 (δ = −72°) showing the highest amplitude.
Current usage metrics show cumulative count of Article Views (full-text article views including HTML views, PDF and ePub downloads, according to the available data) and Abstracts Views on Vision4Press platform.
Data correspond to usage on the plateform after 2015. The current usage metrics is available 48-96 hours after online publication and is updated daily on week days.
Initial download of the metrics may take a while.