Fig. 3
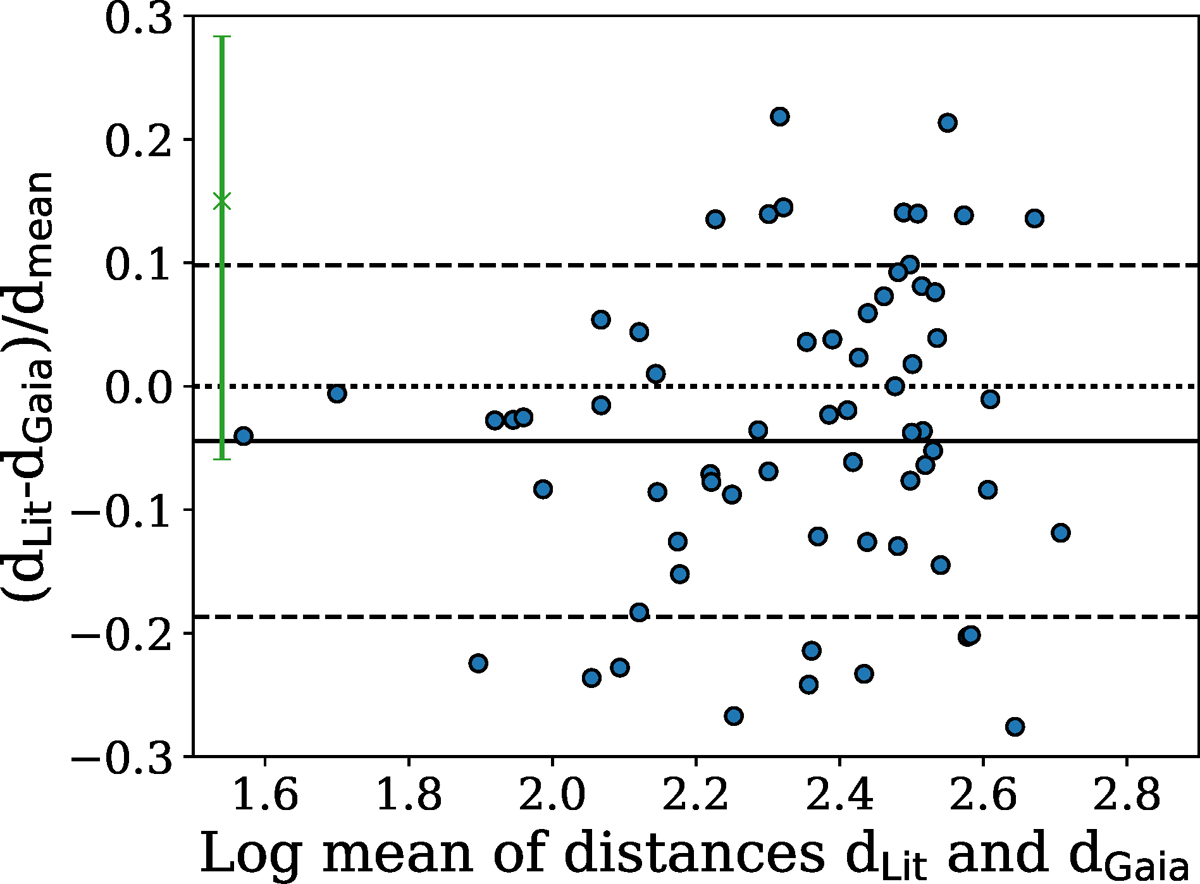
A comparison between previously published distances dLit and distances derived from the TGAS parallaxes dGaia. The figure shows all published HAT and WASP systems where both values are available, with each system plotted using the log of the mean of the two distance values, and the fractional difference between the two values. The green data point at top left illustrates the median error bar, with individual error bars excluded for clarity. The solid and dashed lines indicate the mean difference and rms scatter between the two sets of data; the dotted line shows where points would fall if there were no systematic offset. We find that the exoplanet literature distances are systematically 4.4 ± 1.5% lower than the TGAS distances, with an rms scatter of 14% between the two sets of data.
Current usage metrics show cumulative count of Article Views (full-text article views including HTML views, PDF and ePub downloads, according to the available data) and Abstracts Views on Vision4Press platform.
Data correspond to usage on the plateform after 2015. The current usage metrics is available 48-96 hours after online publication and is updated daily on week days.
Initial download of the metrics may take a while.