Fig. 1
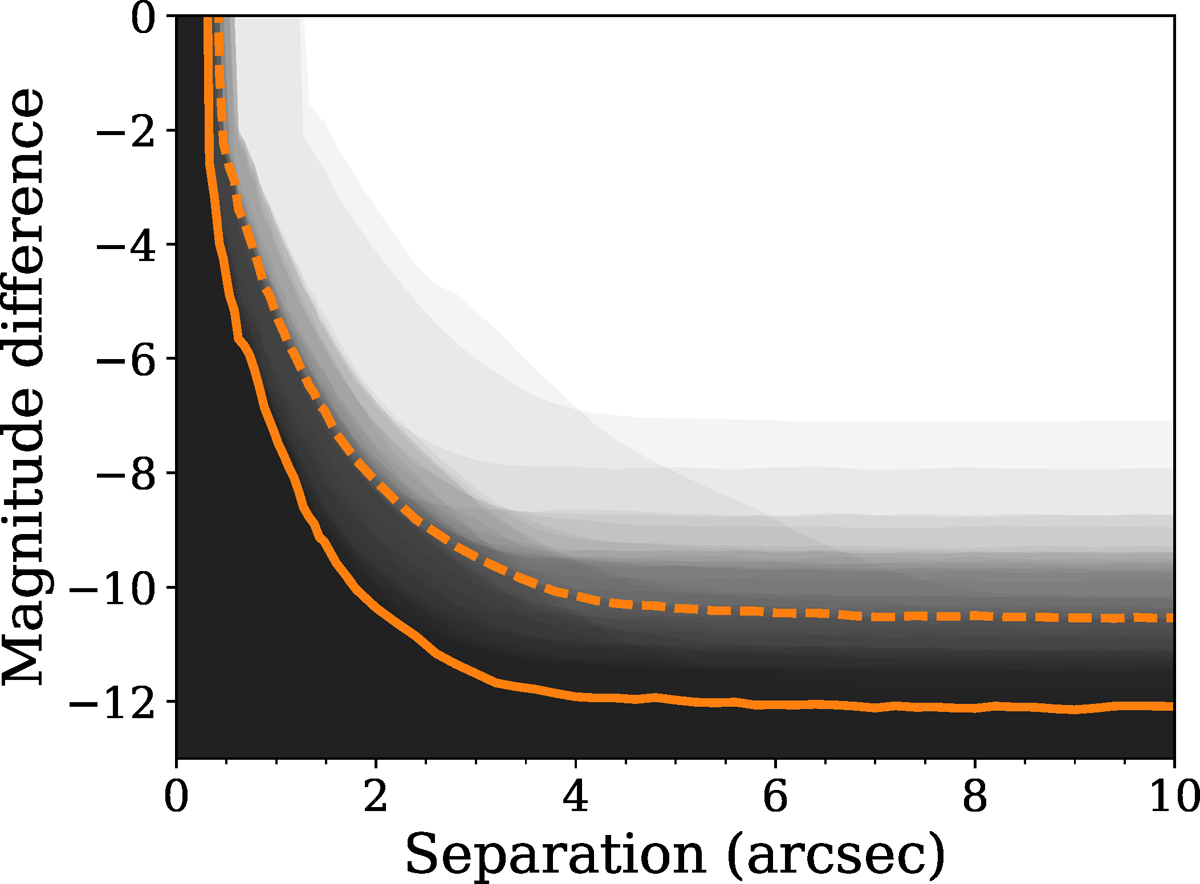
5-sigma detection limits for our 2015 observations. The dashed line indicates the median sensitivity, whilst the solid line indicates the maximum sensitivity achieved for any observation. Shading on the figure indicates for what fraction of our observations a companion of a given separation and magnitude difference would be detectable. A region that is entirely black indicates that a companion would not be detected in any observation, whilst a region that is white indicates that a companion would be detected in all observations. All detection curves remain essentially flat beyond 10′′.
Current usage metrics show cumulative count of Article Views (full-text article views including HTML views, PDF and ePub downloads, according to the available data) and Abstracts Views on Vision4Press platform.
Data correspond to usage on the plateform after 2015. The current usage metrics is available 48-96 hours after online publication and is updated daily on week days.
Initial download of the metrics may take a while.