Fig. 8
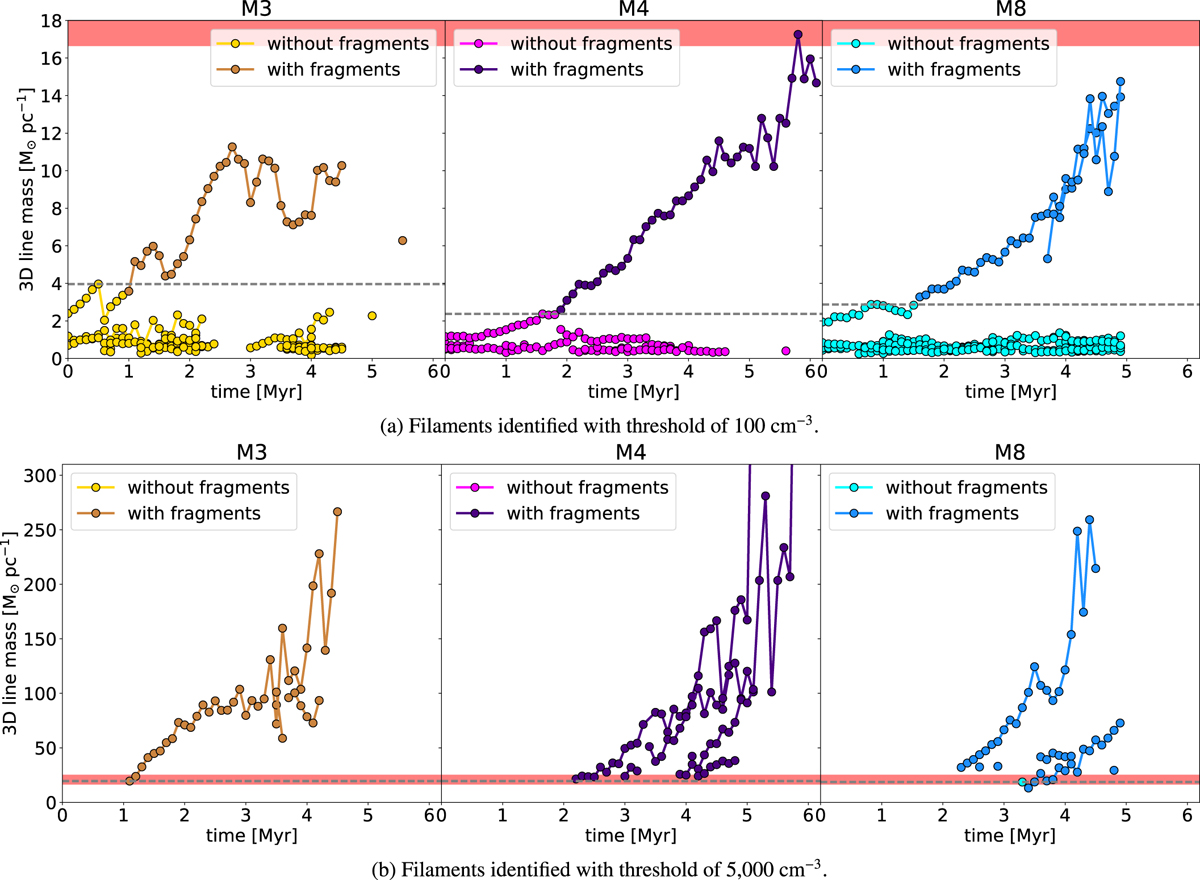
Evolution of line mass of individual filaments. Each line represents a single filament, with dots showing its line mass at each output time step. The light dots illustrate the time steps when the respective filament does not contain any fragments, the darker dots show these time steps when the filament contains at least one fragment. The red area illustrates the critical line mass at which isothermal filaments with temperatures between 10 and 15 K become unstable against collapse according to the (Ostriker 1964b) model. The grey dashed line shows the maximum line mass of filaments without fragments in the simulation.
Current usage metrics show cumulative count of Article Views (full-text article views including HTML views, PDF and ePub downloads, according to the available data) and Abstracts Views on Vision4Press platform.
Data correspond to usage on the plateform after 2015. The current usage metrics is available 48-96 hours after online publication and is updated daily on week days.
Initial download of the metrics may take a while.