Fig. 6
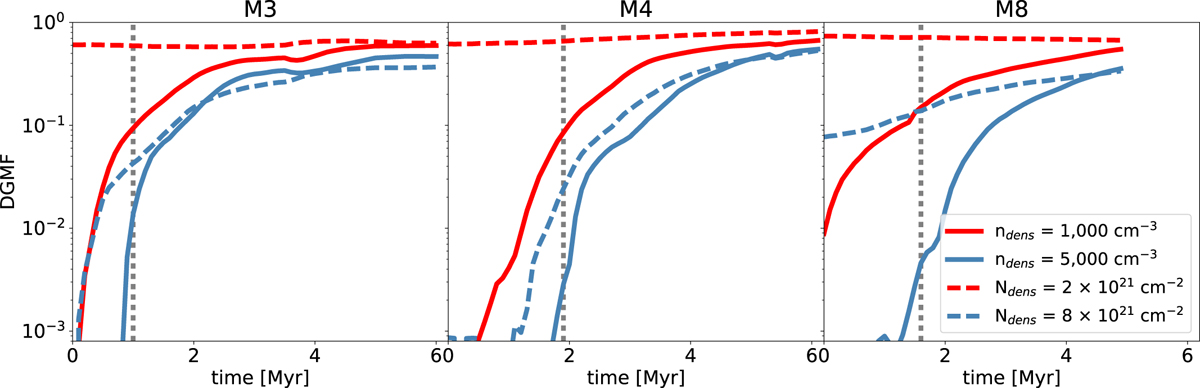
Evolution of DGMF in the model clouds as a function of time. Solid lines give DGMFs measured from 3D volume density cubes, while dashed lines are from 2D column density maps. Red lines correspond to dense gas above number and column density thresholds of 1000 cm−3 and 2 × 1021 cm−2, and blue lines correspond to dense gas above 5000 cm−3 and 8 × 1021 cm−2 respectively. We see that after self-gravity is activated the gas condenses rapidly, before the growth rate almost stagnates after 2 Myr which corresponds to the clouds’ global free-fall times. The grey dashed lines mark the times when the first fragments in each simulation form.
Current usage metrics show cumulative count of Article Views (full-text article views including HTML views, PDF and ePub downloads, according to the available data) and Abstracts Views on Vision4Press platform.
Data correspond to usage on the plateform after 2015. The current usage metrics is available 48-96 hours after online publication and is updated daily on week days.
Initial download of the metrics may take a while.