Fig. 3
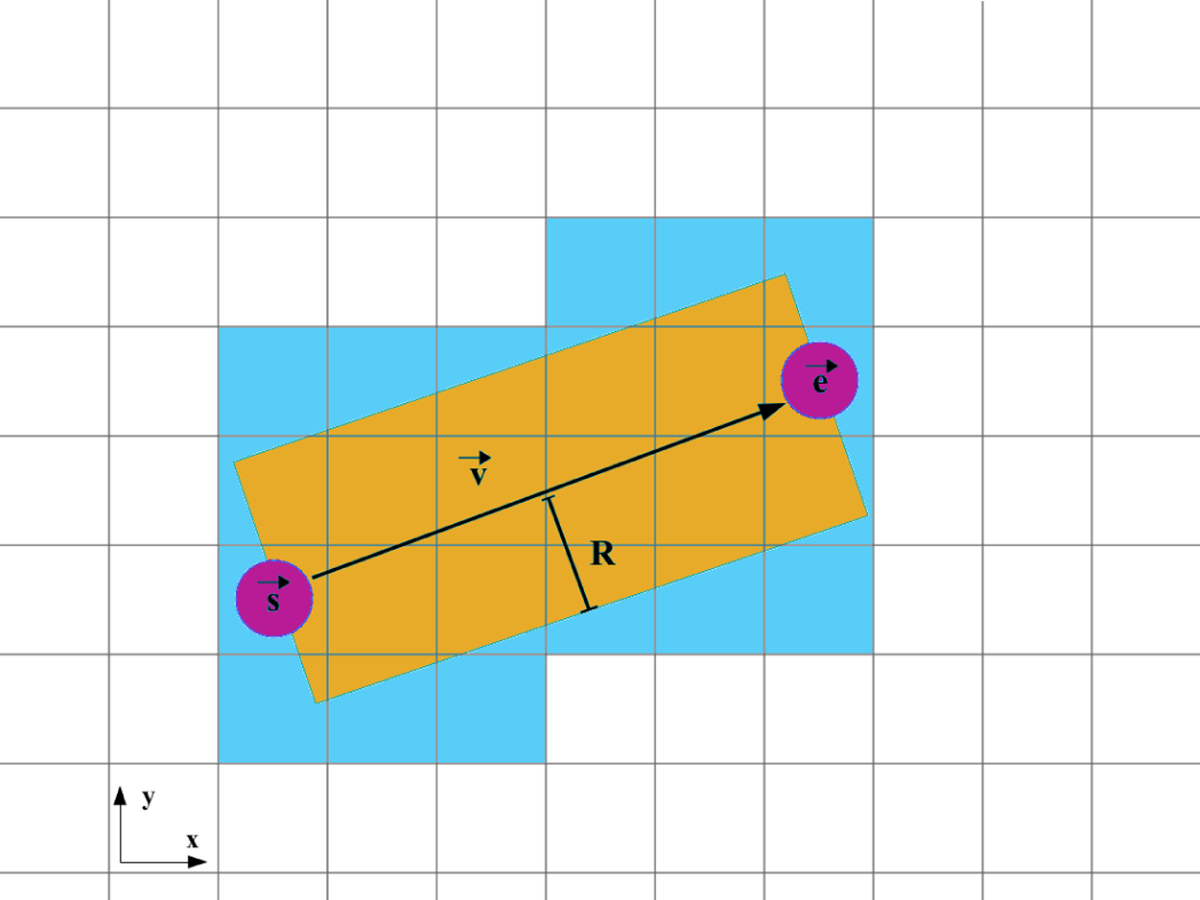
2D sketch describing how filament volume is defined. The purple circles represent the positions of the starting point s, and end point e on the data grid. The filament is defined as the orange cylinder with axis v and radius R. The blue area shows the grid cells actually used to compute the mass, volume, and other quantities.
Current usage metrics show cumulative count of Article Views (full-text article views including HTML views, PDF and ePub downloads, according to the available data) and Abstracts Views on Vision4Press platform.
Data correspond to usage on the plateform after 2015. The current usage metrics is available 48-96 hours after online publication and is updated daily on week days.
Initial download of the metrics may take a while.