Free Access
Fig. 9
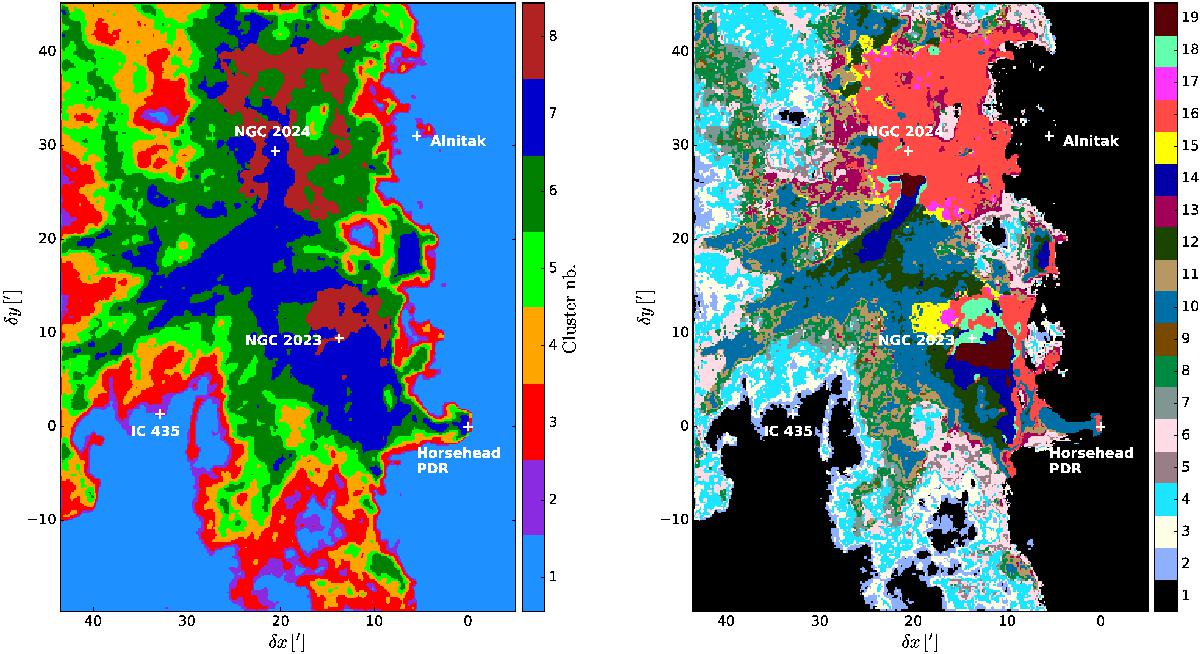
Comparison of the clusters obtained based on the CO isotopologues alone (left) and the clusters obtained when associating the CO isotopologues to HCO+ and CN (right). In both cases, the clusters have been ordered by increasing 12CO (1–0) mean intensity. White crosses mark the positions of remarkable regions.
This figure is made of several images, please see below:
Current usage metrics show cumulative count of Article Views (full-text article views including HTML views, PDF and ePub downloads, according to the available data) and Abstracts Views on Vision4Press platform.
Data correspond to usage on the plateform after 2015. The current usage metrics is available 48-96 hours after online publication and is updated daily on week days.
Initial download of the metrics may take a while.