Fig. 8
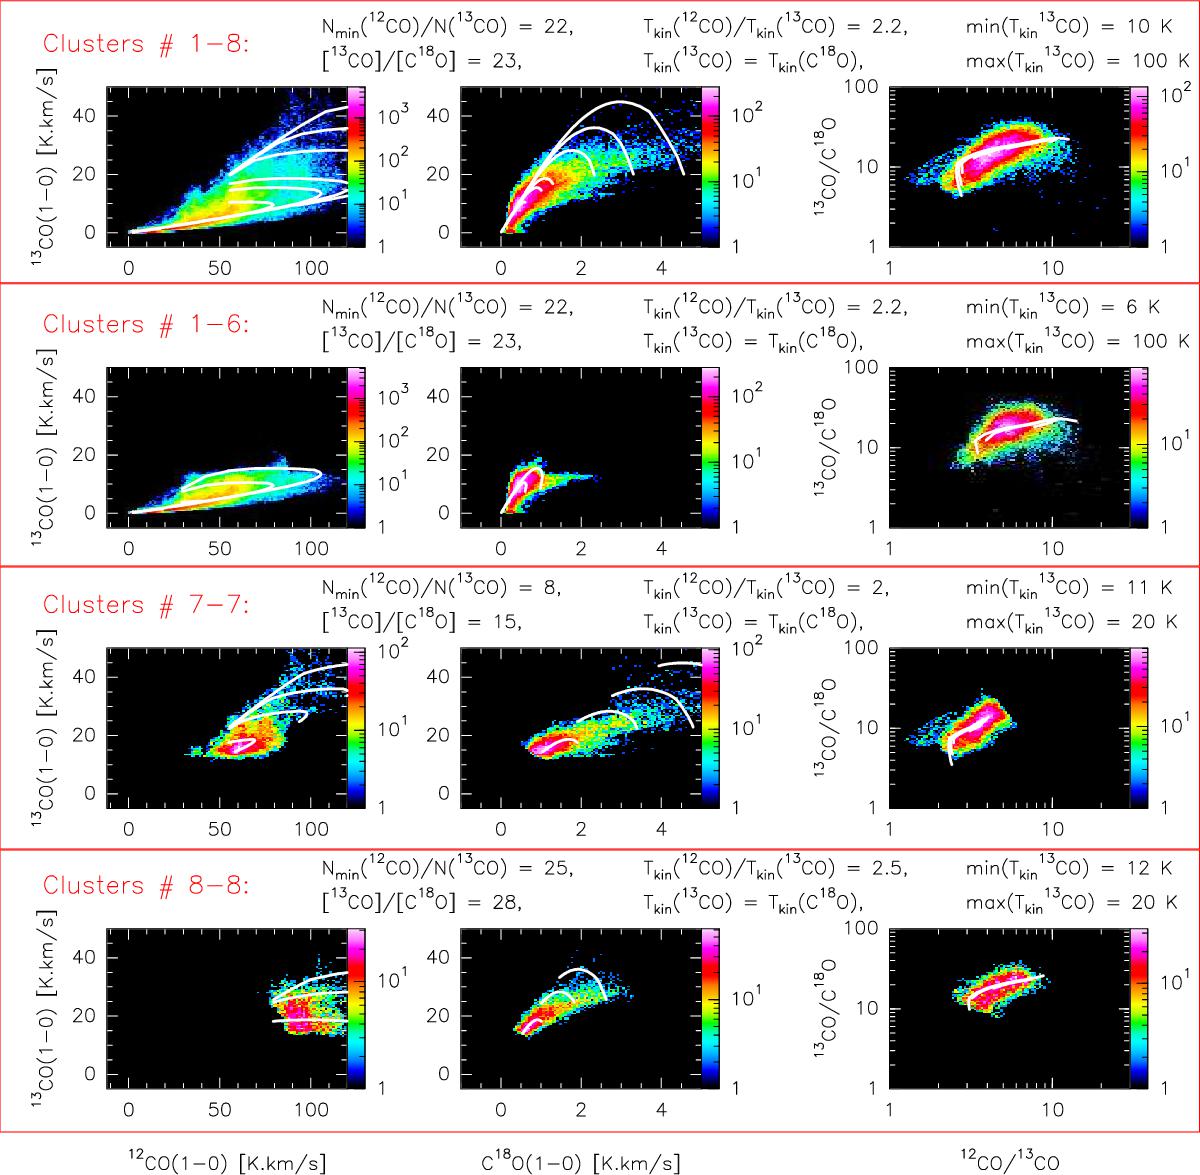
LTE radiative transfer models for the three main CO isotopologues. The four rows show the best match between the observations and the models for, from top to bottom, the full field of view studied here, clusters 1 to 6, and the 7th and 8th clusters. The control parameters of the family of models are written on top of each associated row. The left and middle columns show the joint histogram of the (1–0) lines of 13CO vs. 12CO, and of 13CO vs. C18O. The right column shows the joint histogram of the 13CO/ C18O vs. 12CO /13CO intensity ratios. The colour look-up tables show the number of lines of sight that fall within a given bin of the histogram. The white curves present the LTE intensity variations as a function of the 13CO kinetic temperature for different fixed 13CO opacities (0.03, 0.1, 0.3, 0.5, 0.65, 1.2, 1.75, 2.5).
Current usage metrics show cumulative count of Article Views (full-text article views including HTML views, PDF and ePub downloads, according to the available data) and Abstracts Views on Vision4Press platform.
Data correspond to usage on the plateform after 2015. The current usage metrics is available 48-96 hours after online publication and is updated daily on week days.
Initial download of the metrics may take a while.